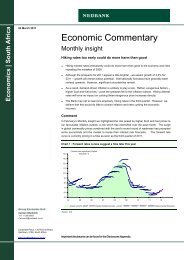
Trading market risk profileThe tables below reflect the VaR statistics for the <strong>Nedbank</strong> <strong>Group</strong> trading book activities for 2008 and 2009.<strong>Group</strong> trading book VaR for 2009 (i)Historical VaR (99%, one-day) by risk typeRisk categoriesRm Average Minimum (ii) Maximum (ii) Year-endForeign exchange 4,1 1,0 10,3 3,7Interest rate 16,9 7,2 28,7 7,4Equity 6,3 2,5 13,3 3,8Credit 6,0 2,5 10,9 3,2Commodity 0,5 2,4 1,2Diversification (iii) (12,5) (6,0)Total VaR exposure 21,3 9,9 33,1 13,3GROUP REPORTS<strong>Group</strong> trading book VaR for 2008 (i)Risk categoriesRmHistorical VaR (99%, one-day) by risk typeAverage Minimum (ii) Maximum (ii) Year-endForeign exchange 6,1 2,3 20,1 3,4Interest rate 13,8 7,4 25,0 19,3Equity 7,8 3,3 21,2 6,5Credit 6,2 3,4 8,7 6,6Diversification (iii) (14,2) (11,8)Total VaR exposure 19,7 10,3 36,5 24,0(i) Certain positions are illiquid and VaR may not always be the most appropriate measure of risk (a summary of the ‘other market risk measures’applied to mitigate this will follow).(ii) The maximum and minimum VaR values reported for each of the different risk factors did not necessarily occur on the same day. As a result adiversification number for the maximum and minimum values have been omitted from the table.(iii) Diversification benefit is the difference between the aggregate VaR and the sum of VaRs for the four risk categories. This benefit arises because thesimulated 99%/one-day loss for each of the four primary market risk categories occurs on different days.<strong>Nedbank</strong> <strong>Group</strong>’s trading market risk exposure expressed as average daily VaR increased by 8,1% from R19,7 million toR21,3 million. The increase was mainly due to an increase in exposure to the interest rate markets in 2009.The graph overleaf illustrates the daily VaR for the period 1 January 2009 to 31 December 2009. <strong>Nedbank</strong> <strong>Group</strong> remained withinthe approved risk appetite and the VaR limits allocated by the board. The daily VaR for the second half of 2009 decreased as thefinancial markets stabilised.OPERATIONAL REVIEWSGOVERNANCEOVERVIEW161<strong>NEDBANK</strong> GROUP ANNUAL REPORT 2009
isk and BALANCE SHEET management reportVaR utilisation for 2009 (99%, one-day VaR)VaR RmOne-day VaRAverage VaR 2009The risk appetite within all the risk factors remained largely unchanged, with foreign exchange and interest rate activities againproducing consistent revenue.VaR is an important measurement tool and the performance of the model is regularly assessed. The approach to assessing whetherthe model is performing adequately is known as backtesting. Backtesting is simply a historical test of the accuracy of the VaRmodel. To conduct a backtest the bank reviews its actual daily VaR over one year (about 250 trading days) and compares the actualdaily trading revenue (including net interest but excluding commissions and primary revenue) outcomes with its VaR estimate andcounts the number of times the trading loss exceeds the VaR estimate.<strong>Nedbank</strong> <strong>Group</strong> used a holding period of one day with a confidence level of 99%, and had no backtesting exceptions for 2009. Thissuggests that VaR, as currently implemented, has been a conservative measure of the potential net revenue variability on the dailytrading activities.VaR profit and loss for 2009Profit and lossVaR RmVaR162<strong>NEDBANK</strong> GROUP ANNUAL REPORT 2009