NEDBANK CAPITAl - Nedbank Group Limited
NEDBANK CAPITAl - Nedbank Group Limited
NEDBANK CAPITAl - Nedbank Group Limited
- No tags were found...

Create successful ePaper yourself
Turn your PDF publications into a flip-book with our unique Google optimized e-Paper software.
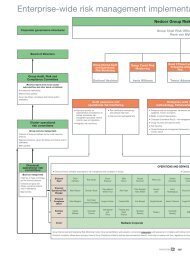
isk and BALANCE SHEET management reportCredit risk economic capital decreased from R15,6 billion to R13,5 billion (old basis) over the period. Both credit risk economic andregulatory capital decreased as a result of the optimisation of risk-weighted assets.These decreases were offset by increases in property and operational risk. Property risk has increased as a result of the increase inproperties in possession due to the worsening economic conditions. Operational risk increased due to the inclusion of the ‘mostrecent year of gross income’ data in the calculation under TSA.In conclusion, <strong>Nedbank</strong> <strong>Group</strong>’s economic capital adequacy is strong at its new A (99,93%) target debt rating (solvency standard),with surpluses at group level of R11,8 billion (R16,1 billion on the old basis at an A- target rating). This is after providing for a 10%economic capital buffer, which is subject to sophisticated stress testing.• Capital allocation (risk-based) to business clustersA summary of economic capital requirement at year-end by business cluster (on the old basis)* is presented below:Risk typeRm<strong>Nedbank</strong><strong>Group</strong><strong>Nedbank</strong>Corporate<strong>Nedbank</strong>Business Banking<strong>Nedbank</strong>Capital<strong>Nedbank</strong>RetailImperialBankBSM/Other2009 2008 2009 2008 2009 2008 2009 2008 2009 2008 2009 2008 2009 2008Credit risk 13 541 15 605 3 472 3 897 1 780 3 182 816 934 5 925 6 122 1 536 1 450 12 20Transfer (sovereign)risk 134 166 39 64 95 102Market risk 3 300 3 066 601 520 3 6 1 281 1 216 450 399 32 13 933 912Trading risk 428 352 428 352IRRBB risk 39 33 39 33Property risk 1 121 1 019 37 34 3 5 257 212 32 13 792 755Investment risk 1 679 1 635 560 484 1 841 853 178 174 100 123Forex translation risk 33 27 4 2 12 11 15 13 2 1Operational risk 2 548 1 682 438 284 407 275 299 251 1 279 803 101 51 24 18Business risk 4 133 4 798 702 745 616 676 627 1 241 2 031 2 009 157 127Other assets risk 595 689 44 176 35 19 21 177 174 25 1 330 282Total 24 251 26 005 5 296 5 686 2 806 4 174 3 137 3 765 9 862 9 507 1 851 1 642 1 299 1 232* (On old economic capital basis, as the new basis is effective for capital allocation purposes only from 2010.)The target debt solvency change will be effective for risk-adjusted performance measurement from 2010 and, as a result, isnot effective in the business cluster results above. In addition, there are a number of economic capital allocation methodologyenhancements that will be implemented for 2010, which are expected to have a significant impact on the allocation of capital acrossthe group’s business clusters. The impact of the changes by business cluster will be disclosed with the 2010 interim results. Thefollowing is a summary of the key enhancements being implemented for 2010:– Full alignment of the group’s actual book capital, with the aggregate amount allocated to the various business clusters usingbottomup economic capital.– Updating of the credit portfolio modelling correlations and revising the credit economic capital allocation methodology takinginto account recent global developments (including downturn years) and the new regulatory thinking in line with the new Basel IIIproposals discussed earlier.– Measurement of operational risk for economic capital purposes using the Advanced Measurement Approach instead of TSA.184<strong>NEDBANK</strong> GROUP ANNUAL REPORT 2009