NEDBANK CAPITAl - Nedbank Group Limited
NEDBANK CAPITAl - Nedbank Group Limited
NEDBANK CAPITAl - Nedbank Group Limited
- No tags were found...

Create successful ePaper yourself
Turn your PDF publications into a flip-book with our unique Google optimized e-Paper software.
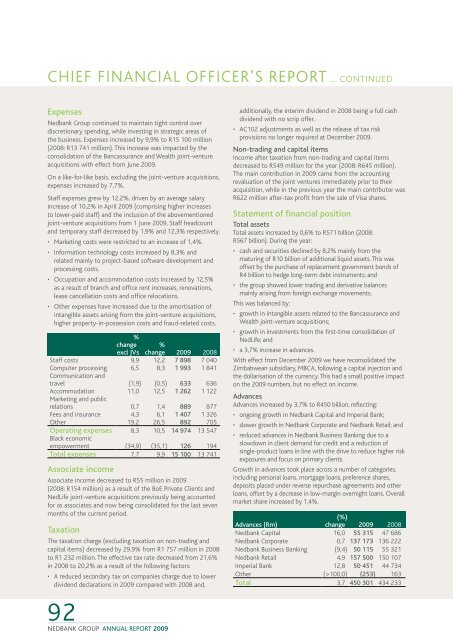
CHIEF FINANCIAL OFFICER’S REPORT ... continuedExpenses<strong>Nedbank</strong> <strong>Group</strong> continued to maintain tight control overdiscretionary spending, while investing in strategic areas ofthe business. Expenses increased by 9,9% to R15 100 million(2008: R13 741 million). This increase was impacted by theconsolidation of the Bancassurance and Wealth joint-ventureacquisitions with effect from June 2009.On a like-for-like basis, excluding the joint-venture acquisitions,expenses increased by 7,7%.Staff expenses grew by 12,2%, driven by an average salaryincrease of 10,2% in April 2009 (comprising higher increasesto lower-paid staff) and the inclusion of the abovementionedjoint-venture acquisitions from 1 June 2009. Staff headcountand temporary staff decreased by 1,9% and 12,3% respectively.• Marketing costs were restricted to an increase of 1,4%.• Information technology costs increased by 8,3% andrelated mainly to project-based software development andprocessing costs.• Occupation and accommodation costs increased by 12,5%as a result of branch and office rent increases, renovations,lease cancellation costs and office relocations.• Other expenses have increased due to the amortisation ofintangible assets arising from the joint-venture acquisitions,higher property-in-possession costs and fraud-related costs.%changeexcl JVs%change 2009 2008Staff costs 9,9 12,2 7 898 7 040Computer processing 6,5 8,3 1 993 1 841Communication andtravel (1,9) (0,5) 633 636Accommodation 11,0 12,5 1 262 1 122Marketing and publicrelations 0,7 1,4 889 877Fees and insurance 4,3 6,1 1 407 1 326Other 19,2 26,5 892 705Operating expenses 8,3 10,5 14 974 13 547Black economicempowerment (34,9) (35,1) 126 194Total expenses 7,7 9,9 15 100 13 741Associate incomeAssociate income decreased to R55 million in 2009(2008: R154 million) as a result of the BoE Private Clients andNedLife joint-venture acquisitions previously being accountedfor as associates and now being consolidated for the last sevenmonths of the current period.TaxationThe taxation charge (excluding taxation on non-trading andcapital items) decreased by 29,9% from R1 757 million in 2008to R1 232 million. The effective tax rate decreased from 21,6%in 2008 to 20,2% as a result of the following factors:• A reduced secondary tax on companies charge due to lowerdividend declarations in 2009 compared with 2008 and,92<strong>NEDBANK</strong> GROUP ANNUAL REPORT 2009additionally, the interim dividend in 2008 being a full cashdividend with no scrip offer.• AC102 adjustments as well as the release of tax riskprovisions no longer required at December 2009.Non-trading and capital itemsIncome after taxation from non-trading and capital itemsdecreased to R549 million for the year (2008: R645 million).The main contribution in 2009 came from the accountingrevaluation of the joint ventures immediately prior to theiracquisition, while in the previous year the main contributor wasR622 million after-tax profit from the sale of Visa shares.Statement of financial positionTotal assetsTotal assets increased by 0,6% to R571 billion (2008:R567 billion). During the year:• cash and securities declined by 8,2% mainly from thematuring of R10 billion of additional liquid assets. This wasoffset by the purchase of replacement government bonds ofR4 billion to hedge long-term debt instruments; and• the group showed lower trading and derivative balancesmainly arising from foreign exchange movements.This was balanced by:• growth in intangible assets related to the Bancassurance andWealth joint-venture acquisitions;• growth in investments from the first-time consolidation ofNedLife; and• a 3,7% increase in advances.With effect from December 2009 we have reconsolidated theZimbabwean subsidiary, MBCA, following a capital injection andthe dollarisation of the currency. This had a small positive impacton the 2009 numbers, but no effect on income.AdvancesAdvances increased by 3,7% to R450 billion, reflecting:• ongoing growth in <strong>Nedbank</strong> Capital and Imperial Bank;• slower growth in <strong>Nedbank</strong> Corporate and <strong>Nedbank</strong> Retail; and• reduced advances in <strong>Nedbank</strong> Business Banking due to aslowdown in client demand for credit and a reduction ofsingle-product loans in line with the drive to reduce higher riskexposures and focus on primary clients.Growth in advances took place across a number of categories,including personal loans, mortgage loans, preference shares,deposits placed under reverse repurchase agreements and otherloans, offset by a decrease in low-margin overnight loans. Overallmarket share increased by 1,4%.Advances (Rm)(%)change 2009 2008<strong>Nedbank</strong> Capital 16,0 55 315 47 686<strong>Nedbank</strong> Corporate 0,7 137 173 136 222<strong>Nedbank</strong> Business Banking (9,4) 50 115 55 321<strong>Nedbank</strong> Retail 4,9 157 500 150 107Imperial Bank 12,8 50 451 44 734Other (>100,0) (253) 163Total 3,7 450 301 434 233