Download Sabmiller Plc Annual Report 2012 PDF
Download Sabmiller Plc Annual Report 2012 PDF
Download Sabmiller Plc Annual Report 2012 PDF

You also want an ePaper? Increase the reach of your titles
YUMPU automatically turns print PDFs into web optimized ePapers that Google loves.
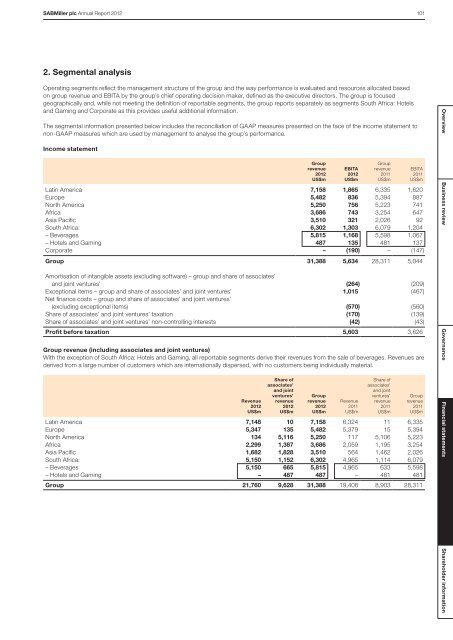
SABMiller plc <strong>Annual</strong> <strong>Report</strong> <strong>2012</strong> 1012. Segmental analysisOperating segments reflect the management structure of the group and the way performance is evaluated and resources allocated basedon group revenue and EBITA by the group’s chief operating decision maker, defined as the executive directors. The group is focusedgeographically and, while not meeting the definition of reportable segments, the group reports separately as segments South Africa: Hotelsand Gaming and Corporate as this provides useful additional information.The segmental information presented below includes the reconciliation of GAAP measures presented on the face of the income statement tonon-GAAP measures which are used by management to analyse the group’s performance.Income statementGrouprevenue<strong>2012</strong>US$mLatin America 7,158 1,865 6,335 1,620Europe 5,482 836 5,394 887North America 5,250 756 5,223 741Africa 3,686 743 3,254 647Asia Pacific 3,510 321 2,026 92South Africa: 6,302 1,303 6,079 1,204– Beverages 5,815 1,168 5,598 1,067– Hotels and Gaming 487 135 481 137Corporate – (190) – (147)Group 31,388 5,634 28,311 5,044Amortisation of intangible assets (excluding software) – group and share of associates’and joint ventures’ (264) (209)Exceptional items – group and share of associates’ and joint ventures’ 1,015 (467)Net finance costs – group and share of associates’ and joint ventures’(excluding exceptional items) (570) (560)Share of associates’ and joint ventures’ taxation (170) (139)Share of associates’ and joint ventures’ non-controlling interests (42) (43)Profit before taxation 5,603 3,626Group revenue (including associates and joint ventures)With the exception of South Africa: Hotels and Gaming, all reportable segments derive their revenues from the sale of beverages. Revenues arederived from a large number of customers which are internationally dispersed, with no customers being individually material.Revenue<strong>2012</strong>US$mShare ofassociates’and jointventures’revenue<strong>2012</strong>US$mGrouprevenue<strong>2012</strong>US$mEBITA<strong>2012</strong>US$mRevenue2011US$mGrouprevenue2011US$mShare ofassociates’and jointventures’revenue2011US$mLatin America 7,148 10 7,158 6,324 11 6,335Europe 5,347 135 5,482 5,379 15 5,394North America 134 5,116 5,250 117 5,106 5,223Africa 2,299 1,387 3,686 2,059 1,195 3,254Asia Pacific 1,682 1,828 3,510 564 1,462 2,026South Africa: 5,150 1,152 6,302 4,965 1,114 6,079– Beverages 5,150 665 5,815 4,965 633 5,598– Hotels and Gaming – 487 487 – 481 481Group 21,760 9,628 31,388 19,408 8,903 28,311EBITA2011US$mGrouprevenue2011US$mOverview Business review Governance Financial statements Shareholder information