Download Sabmiller Plc Annual Report 2012 PDF
Download Sabmiller Plc Annual Report 2012 PDF
Download Sabmiller Plc Annual Report 2012 PDF
Create successful ePaper yourself
Turn your PDF publications into a flip-book with our unique Google optimized e-Paper software.
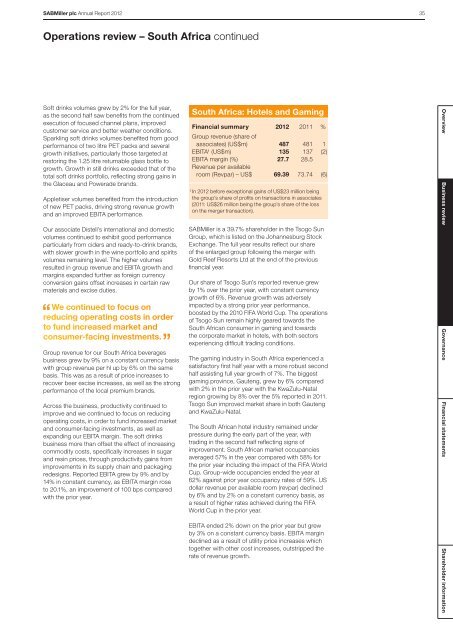
SABMiller plc <strong>Annual</strong> <strong>Report</strong> <strong>2012</strong> 35Operations review – South Africa continuedSoft drinks volumes grew by 2% for the full year,as the second half saw benefits from the continuedexecution of focused channel plans, improvedcustomer service and better weather conditions.Sparkling soft drinks volumes benefited from goodperformance of two litre PET packs and severalgrowth initiatives, particularly those targeted atrestoring the 1.25 litre returnable glass bottle togrowth. Growth in still drinks exceeded that of thetotal soft drinks portfolio, reflecting strong gains inthe Glaceau and Powerade brands.Appletiser volumes benefited from the introductionof new PET packs, driving strong revenue growthand an improved EBITA performance.Our associate Distell’s international and domesticvolumes continued to exhibit good performanceparticularly from ciders and ready-to-drink brands,with slower growth in the wine portfolio and spiritsvolumes remaining level. The higher volumesresulted in group revenue and EBITA growth andmargins expanded further as foreign currencyconversion gains offset increases in certain rawmaterials and excise duties.We continued to focus onreducing operating costs in orderto fund increased market andconsumer-facing investments.Group revenue for our South Africa beveragesbusiness grew by 9% on a constant currency basiswith group revenue per hl up by 6% on the samebasis. This was as a result of price increases torecover beer excise increases, as well as the strongperformance of the local premium brands.Across the business, productivity continued toimprove and we continued to focus on reducingoperating costs, in order to fund increased marketand consumer-facing investments, as well asexpanding our EBITA margin. The soft drinksbusiness more than offset the effect of increasingcommodity costs, specifically increases in sugarand resin prices, through productivity gains fromimprovements in its supply chain and packagingredesigns. <strong>Report</strong>ed EBITA grew by 9% and by14% in constant currency, as EBITA margin roseto 20.1%, an improvement of 100 bps comparedwith the prior year.South Africa: Hotels and GamingFinancial summary <strong>2012</strong> 2011 %Group revenue (share ofassociates) (US$m) 487 481 1EBITA¹ (US$m) 135 137 (2)EBITA margin (%) 27.7 28.5Revenue per availableroom (Revpar) – US$ 69.39 73.74 (6)1 In <strong>2012</strong> before exceptional gains of US$23 million beingthe group’s share of profits on transactions in associates(2011: US$26 million being the group’s share of the losson the merger transaction).SABMiller is a 39.7% shareholder in the Tsogo SunGroup, which is listed on the Johannesburg StockExchange. The full year results reflect our shareof the enlarged group following the merger withGold Reef Resorts Ltd at the end of the previousfinancial year.Our share of Tsogo Sun’s reported revenue grewby 1% over the prior year, with constant currencygrowth of 6%. Revenue growth was adverselyimpacted by a strong prior year performance,boosted by the 2010 FIFA World Cup. The operationsof Tsogo Sun remain highly geared towards theSouth African consumer in gaming and towardsthe corporate market in hotels, with both sectorsexperiencing difficult trading conditions.The gaming industry in South Africa experienced asatisfactory first half year with a more robust secondhalf assisting full year growth of 7%. The biggestgaming province, Gauteng, grew by 6% comparedwith 2% in the prior year with the KwaZulu-Natalregion growing by 8% over the 5% reported in 2011.Tsogo Sun improved market share in both Gautengand KwaZulu-Natal.The South African hotel industry remained underpressure during the early part of the year, withtrading in the second half reflecting signs ofimprovement. South African market occupanciesaveraged 57% in the year compared with 58% forthe prior year including the impact of the FIFA WorldCup. Group-wide occupancies ended the year at62% against prior year occupancy rates of 59%. USdollar revenue per available room (revpar) declinedby 6% and by 2% on a constant currency basis, asa result of higher rates achieved during the FIFAWorld Cup in the prior year.EBITA ended 2% down on the prior year but grewby 3% on a constant currency basis. EBITA margindeclined as a result of utility price increases whichtogether with other cost increases, outstripped therate of revenue growth.Overview Business review Governance Financial statements Shareholder information


