Download Sabmiller Plc Annual Report 2012 PDF
Download Sabmiller Plc Annual Report 2012 PDF
Download Sabmiller Plc Annual Report 2012 PDF

Create successful ePaper yourself
Turn your PDF publications into a flip-book with our unique Google optimized e-Paper software.
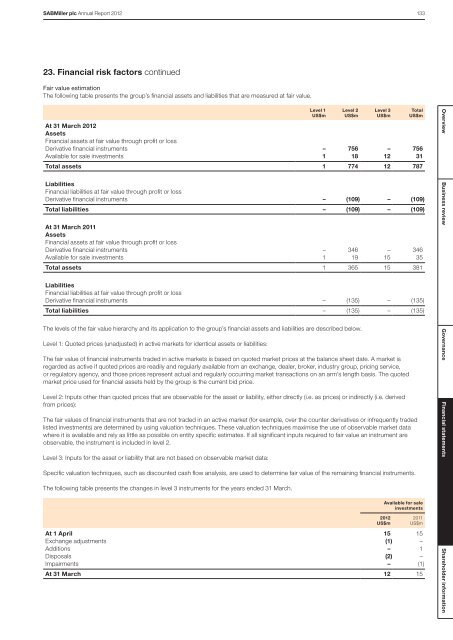
SABMiller plc <strong>Annual</strong> <strong>Report</strong> <strong>2012</strong> 13323. Financial risk factors continuedFair value estimationThe following table presents the group’s financial assets and liabilities that are measured at fair value.At 31 March <strong>2012</strong>AssetsFinancial assets at fair value through profit or lossDerivative financial instruments – 756 – 756Available for sale investments 1 18 12 31Total assets 1 774 12 787LiabilitiesFinancial liabilities at fair value through profit or lossDerivative financial instruments – (109) – (109)Total liabilities – (109) – (109)At 31 March 2011AssetsFinancial assets at fair value through profit or lossDerivative financial instruments – 346 – 346Available for sale investments 1 19 15 35Total assets 1 365 15 381LiabilitiesFinancial liabilities at fair value through profit or lossDerivative financial instruments – (135) – (135)Total liabilities – (135) – (135)Level 1US$mLevel 2US$mThe levels of the fair value hierarchy and its application to the group’s financial assets and liabilities are described below.Level 1: Quoted prices (unadjusted) in active markets for identical assets or liabilities:The fair value of financial instruments traded in active markets is based on quoted market prices at the balance sheet date. A market isregarded as active if quoted prices are readily and regularly available from an exchange, dealer, broker, industry group, pricing service,or regulatory agency, and those prices represent actual and regularly occurring market transactions on an arm’s length basis. The quotedmarket price used for financial assets held by the group is the current bid price.Level 2: Inputs other than quoted prices that are observable for the asset or liability, either directly (i.e. as prices) or indirectly (i.e. derivedfrom prices):The fair values of financial instruments that are not traded in an active market (for example, over the counter derivatives or infrequently tradedlisted investments) are determined by using valuation techniques. These valuation techniques maximise the use of observable market datawhere it is available and rely as little as possible on entity specific estimates. If all significant inputs required to fair value an instrument areobservable, the instrument is included in level 2.Level 3: Inputs for the asset or liability that are not based on observable market data:Specific valuation techniques, such as discounted cash flow analysis, are used to determine fair value of the remaining financial instruments.The following table presents the changes in level 3 instruments for the years ended 31 March.Level 3US$m<strong>2012</strong>US$mTotalUS$mAvailable for saleinvestmentsAt 1 April 15 15Exchange adjustments (1) –Additions – 1Disposals (2) –Impairments – (1)At 31 March 12 152011US$mOverview Business review Governance Financial statements Shareholder information