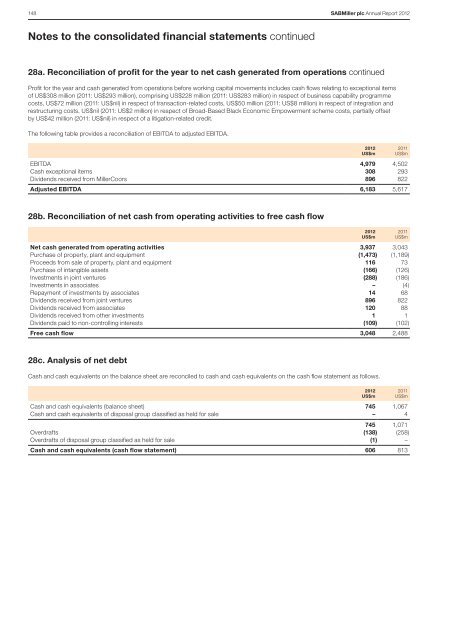
148 SABMiller plc <strong>Annual</strong> <strong>Report</strong> <strong>2012</strong>Notes to the consolidated financial statements continued28a. Reconciliation of profit for the year to net cash generated from operations continuedProfit for the year and cash generated from operations before working capital movements includes cash flows relating to exceptional itemsof US$308 million (2011: US$293 million), comprising US$228 million (2011: US$283 million) in respect of business capability programmecosts, US$72 million (2011: US$nil) in respect of transaction-related costs, US$50 million (2011: US$8 million) in respect of integration andrestructuring costs, US$nil (2011: US$2 million) in respect of Broad-Based Black Economic Empowerment scheme costs, partially offsetby US$42 million (2011: US$nil) in respect of a litigation-related credit.The following table provides a reconciliation of EBITDA to adjusted EBITDA.EBITDA 4,979 4,502Cash exceptional items 308 293Dividends received from MillerCoors 896 822Adjusted EBITDA 6,183 5,617<strong>2012</strong>US$m2011US$m28b. Reconciliation of net cash from operating activities to free cash flowNet cash generated from operating activities 3,937 3,043Purchase of property, plant and equipment (1,473) (1,189)Proceeds from sale of property, plant and equipment 116 73Purchase of intangible assets (166) (126)Investments in joint ventures (288) (186)Investments in associates – (4)Repayment of investments by associates 14 68Dividends received from joint ventures 896 822Dividends received from associates 120 88Dividends received from other investments 1 1Dividends paid to non-controlling interests (109) (102)Free cash flow 3,048 2,488<strong>2012</strong>US$m2011US$m28c. Analysis of net debtCash and cash equivalents on the balance sheet are reconciled to cash and cash equivalents on the cash flow statement as follows.Cash and cash equivalents (balance sheet) 745 1,067Cash and cash equivalents of disposal group classified as held for sale – 4745 1,071Overdrafts (138) (258)Overdrafts of disposal group classified as held for sale (1) –Cash and cash equivalents (cash flow statement) 606 813<strong>2012</strong>US$m2011US$m
SABMiller plc <strong>Annual</strong> <strong>Report</strong> <strong>2012</strong> 14928c. Analysis of net debt continuedNet debt is analysed as follows.Cash andcashequivalents(excludingoverdrafts)US$mOverdraftsUS$mBorrowingsUS$mDerivativefinancialinstrumentsUS$mFinanceleasesUS$mTotalgrossborrowingsUS$mAt 1 April 2010 779 (190) (9,212) 237 (12) (9,177) (8,398)Exchange adjustments 8 17 (174) (3) – (160) (152)Cash flow 283 (72) 1,159 84 5 1,176 1,459Acquisitions – through business combinations 1 (13) – – (1) (14) (13)Other movements – – 34 (20) (1) 13 13At 31 March 2011 1,071 (258) (8,193) 298 (9) (8,162) (7,091)Exchange adjustments 10 (49) (38) 9 – (78) (68)Cash flow (246) 157 (8,861) (43) 5 (8,742) (8,988)Acquisitions – through business combinations 12 – (1,844) 259 (2) (1,587) (1,575)Disposals (102) 11 98 – – 109 7Other movements – – (229) 97 (15) (147) (147)At 31 March <strong>2012</strong> 745 (139) (19,067) 620 (21) (18,607) (17,862)The group’s net debt is denominated in the following currencies.US dollarsUS$mSA randUS$mAustraliandollarsUS$mEuroUS$mColombianpesoUS$mOthercurrenciesUS$mTotal cash and cash equivalents 346 37 49 41 81 191 745Total gross borrowings (including overdrafts) (13,043) (228) (2,190) (1,306) (1,239) (601) (18,607)(12,697) (191) (2,141) (1,265) (1,158) (410) (17,862)Cross currency swaps 2,211 (183) (1,528) (361) – (139) –Net debt at 31 March <strong>2012</strong> (10,486) (374) (3,669) (1,626) (1,158) (549) (17,862)Total cash and cash equivalents 609 30 – 111 96 225 1,071Total gross borrowings (including overdrafts) (4,334) (290) (18) (1,482) (1,202) (836) (8,162)(3,725) (260) (18) (1,371) (1,106) (611) (7,091)Cross currency swaps 1,089 (413) – (116) – (560) –Net debt at 31 March 2011 (2,636) (673) (18) (1,487) (1,106) (1,171) (7,091)28d. Major non-cash transactions<strong>2012</strong>Major non-cash transactions in the year included the following.The disposal of the group’s Angolan operations, Coca-Cola Bottling Luanda SARL, Coca-Cola Bottling Sul de Angola SARL, Empresa deCervejas N’Gola Norte SA, and its interest in Empresa de Cervejas N’Gola SARL, in Africa in exchange for a 27.5% interest in BIH Angola.The contribution of the group’s Russian beer business, SABMiller RUS LLC, and Ukrainian beer business, PJSC Miller Brands Ukraine, toAnadolu Efes in exchange for a 24% economic interest in the enlarged Anadolu Efes group.The remeasurement of the group’s existing 50% interest in the Pacific Beverages joint venture to fair value on the acquisition of the remaining50% interest.2011Major non-cash transactions in the year included the following.IFRS 2 share-based payment charges in relation to the retailer and employee components of the Broad-Based Black Economic Empowerment(BBBEE) scheme in South Africa.The all-share merger of Tsogo Sun with GRR, a Johannesburg Stock Exchange listed business, on 24 February 2011. The transaction waseffected through the acquisition by GRR of Tsogo Sun, and the group exchanged its entire 49% shareholding in Tsogo Sun for a 39.68%shareholding in the listed enlarged entity.NetdebtUS$mTotalUS$mOverview Business review Governance Financial statements Shareholder information