Your fund’s performanceThis section shows your fund’s performance, price, and distribution information for periods ended<strong>March</strong> 31, 2014, the end of the first half of its current fiscal year. In accordance with regulatoryrequirements for mutual funds, we also include expense information taken from the fund’scurrent prospectus. Performance should always be considered in light of a fund’s investmentstrategy. Data represent past performance. Past performance does not guarantee future results.More recent returns may be less or more than those shown. Investment return and principalvalue will fluctuate, and you may have a gain or a loss when you sell your shares. Performanceinformation does not reflect any deduction for taxes a shareholder may owe on fund distributionsor on the redemption of fund shares. For the most recent month-end performance, please visitthe Individual Investors section at putnam.com or call <strong>Putnam</strong> at 1-800-225-1581. Class R, class R5,class R6, and class Y shares are not available to all investors. See the Terms and Definitions sectionin this report for definitions of the share classes offered by your fund.Fund performance Total return for periods ended 3/31/14Class A Class B Class C Class M Class R Class R5 Class R6 Class Y(inception dates) (2/8/94 ) (2/16/94 ) (9/1/94 ) (2/3/95 ) (1/21/03 ) (7/2/12 ) (7/2/12 ) (7/14/94 )BeforesaleschargeAftersales Beforecharge CDSCAfterCDSCBeforeCDSCAfterCDSCBeforesaleschargeAftersaleschargeNetassetvalueNetassetvalueNetassetvalueNetassetvalueAnnual average(life of fund) 7.90 % 7.58 % 7.59 % 7.59 % 7.07 % 7.07 % 7.36 % 7.17 % 7.62 % 8.16 % 8.17 % 8.16 %10 years 100.33 88.81 88.94 88.94 85.98 85.98 90.67 83.99 94.89 105.25 105.64 105.21Annual average 7.19 6.56 6.57 6.57 6.40 6.40 6.67 6.29 6.90 7.46 7.48 7.455 years 141.43 127.54 132.66 130.66 132.64 132.64 135.65 127.41 137.98 144.17 144.63 144.11Annual average 19.28 17.87 18.40 18.19 18.40 18.40 18.70 17.86 18.93 19.55 19.59 19.543 years 36.03 28.21 33.11 30.11 33.05 33.05 34.04 29.34 34.96 37.01 37.26 36.98Annual average 10.80 8.64 10.00 9.17 9.99 9.99 10.26 8.96 10.51 11.07 11.13 11.061 year 18.18 11.39 17.31 12.31 17.36 16.36 17.61 13.49 17.83 18.48 18.57 18.496 months 10.91 4.53 10.48 5.48 10.52 9.52 10.61 6.74 10.76 11.04 11.12 11.03Current performance may be lower or higher than the quoted past performance, which cannot guarantee futureresults. After-sales-charge returns for class A and M shares reflect the deduction of the maximum 5.75% and 3.50%sales charge, respectively, levied at the time of purchase. Class B share returns after contingent deferred salescharge (CDSC) reflect the applicable CDSC, which is 5% in the first year, declining over time to 1% in the sixth year,and is eliminated thereafter. Class C share returns after CDSC reflect a 1% CDSC for the first year that is eliminatedthereafter. Class R, R5, R6, and Y shares have no initial sales charge or CDSC. Performance for class B, C, M, R,and Y shares before their inception is derived from the historical performance of class A shares, adjusted for theapplicable sales charge (or CDSC) and the higher operating expenses for such shares, except for class Y shares,for which 12b-1 fees are not applicable. Performance for class R5 and R6 shares prior to their inception is derivedfrom the historical performance of class Y shares and has not been adjusted for the lower investor servicing feesapplicable to class R5 and R6 shares; had it, returns would have been higher.For a portion of the periods, the fund had expense limitations, without which returns would have been lower.Class B share performance reflects conversion to class A shares after eight years.Dynamic Asset Allocation Growth Fund 11
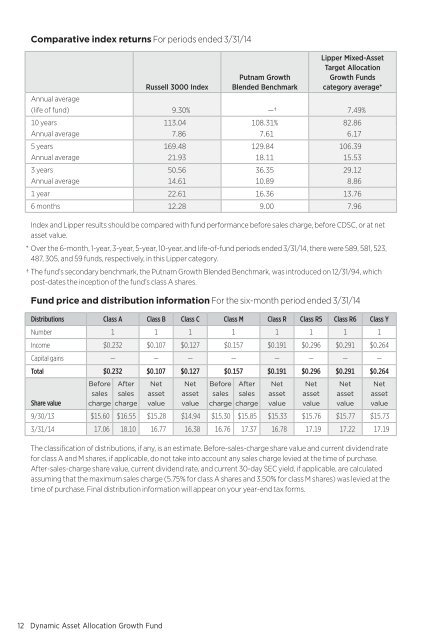
Comparative index returns For periods ended 3/31/14<strong>Putnam</strong> GrowthBlended BenchmarkLipper Mixed-AssetTarget AllocationGrowth Fundscategory average *Russell 3000 IndexAnnual average(life of fund) 9.30 % —† 7.49 %10 years 113.04 108.31 % 82.86Annual average 7.86 7.61 6.175 years 169.48 129.84 106.39Annual average 21.93 18.11 15.533 years 50.56 36.35 29.12Annual average 14.61 10.89 8.861 year 22.61 16.36 13.766 months 12.28 9.00 7.96Index and Lipper results should be compared with fund performance before sales charge, before CDSC, or at netasset value.* Over the 6-month, 1-year, 3-year, 5-year, 10-year, and life-of-fund periods ended 3/31/14, there were 589, 581, 523,487, 305, and 59 funds, respectively, in this Lipper category.† The fund’s secondary benchmark, the <strong>Putnam</strong> Growth Blended Benchmark, was introduced on 12/31/94, whichpost-dates the inception of the fund’s class A shares.Fund price and distribution information For the six-month period ended 3/31/14Distributions Class A Class B Class C Class M Class R Class R5 Class R6 Class YNumber 1 1 1 1 1 1 1 1Income $0.232 $0.107 $0.127 $0.157 $0.191 $0.296 $0.291 $0.264Capital gains — — — — — — — —Total $0.232 $0.107 $0.127 $0.157 $0.191 $0.296 $0.291 $0.264BeforesalesAftersalesNetassetNetassetBeforesalesAftersalesNetassetNetassetNetassetNetassetShare value charge charge value value charge charge value value value value9/30/13 $15.60 $16.55 $15.28 $14.94 $15.30 $15.85 $15.33 $15.76 $15.77 $15.733/31/14 17.06 18.10 16.77 16.38 16.76 17.37 16.78 17.19 17.22 17.19The classification of distributions, if any, is an estimate. Before-sales-charge share value and current dividend ratefor class A and M shares, if applicable, do not take into account any sales charge levied at the time of purchase.After-sales-charge share value, current dividend rate, and current 30-day SEC yield, if applicable, are calculatedassuming that the maximum sales charge (5.75% for class A shares and 3.50% for class M shares) was levied at thetime of purchase. Final distribution information will appear on your year-end tax forms.12 Dynamic Asset Allocation Growth Fund