

March - Putnam Investments
March - Putnam Investments
March - Putnam Investments
- No tags were found...

You also want an ePaper? Increase the reach of your titles
YUMPU automatically turns print PDFs into web optimized ePapers that Google loves.
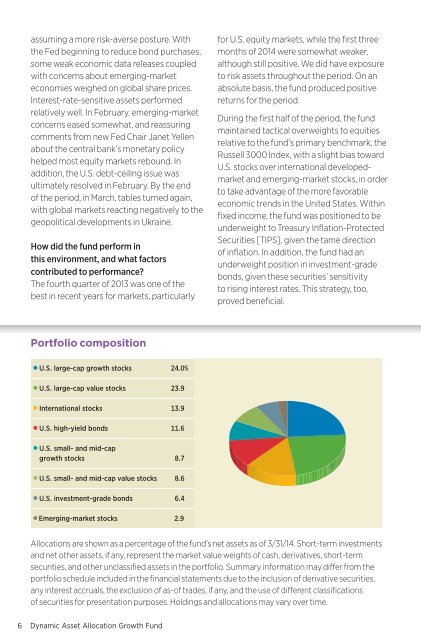
assuming a more risk-averse posture. Withthe Fed beginning to reduce bond purchases,some weak economic data releases coupledwith concerns about emerging-marketeconomies weighed on global share prices.Interest-rate-sensitive assets performedrelatively well. In February, emerging-marketconcerns eased somewhat, and reassuringcomments from new Fed Chair Janet Yellenabout the central bank’s monetary policyhelped most equity markets rebound. Inaddition, the U.S. debt-ceiling issue wasultimately resolved in February. By the endof the period, in <strong>March</strong>, tables turned again,with global markets reacting negatively to thegeopolitical developments in Ukraine.How did the fund perform inthis environment, and what factorscontributed to performance?The fourth quarter of 2013 was one of thebest in recent years for markets, particularlyfor U.S. equity markets, while the first threemonths of 2014 were somewhat weaker,although still positive. We did have exposureto risk assets throughout the period. On anabsolute basis, the fund produced positivereturns for the period.During the first half of the period, the fundmaintained tactical overweights to equitiesrelative to the fund’s primary benchmark, theRussell 3000 Index, with a slight bias towardU.S. stocks over international developedmarketand emerging-market stocks, in orderto take advantage of the more favorableeconomic trends in the United States. Withinfixed income, the fund was positioned to beunderweight to Treasury Inflation-ProtectedSecurities [TIPS], given the tame directionof inflation. In addition, the fund had anunderweight position in investment-gradebonds, given these securities’ sensitivityto rising interest rates. This strategy, too,proved beneficial.Portfolio compositionU.S. large-cap growth stocks 24.0%U.S. large-cap value stocks 23.9International stocks 13.9U.S. high-yield bonds 11.6U.S. small- and mid-capgrowth stocks 8.7U.S. small- and mid-cap value stocks 8.6U.S. investment-grade bonds 6.4Emerging-market stocks 2.9Allocations are shown as a percentage of the fund’s net assets as of 3/31/14. Short-term investmentsand net other assets, if any, represent the market value weights of cash, derivatives, short-termsecurities, and other unclassified assets in the portfolio. Summary information may differ from theportfolio schedule included in the financial statements due to the inclusion of derivative securities,any interest accruals, the exclusion of as-of trades, if any, and the use of different classificationsof securities for presentation purposes. Holdings and allocations may vary over time.6 Dynamic Asset Allocation Growth Fund


