

March - Putnam Investments
March - Putnam Investments
March - Putnam Investments
- No tags were found...

Create successful ePaper yourself
Turn your PDF publications into a flip-book with our unique Google optimized e-Paper software.
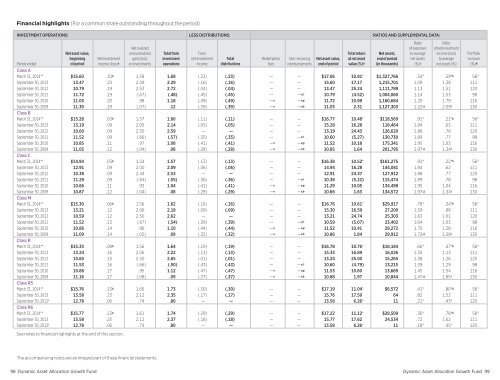
Financial highlights (For a common share outstanding throughout the period)INVESTMENT OPERATIONS: LESS DISTRIBUTIONS: RATIOS AND SUPPLEMENTAL DATA:Period endedNet asset value,beginningof periodNet investmentincome (loss ) aSee notes to financial highlights at the end of this section.Net realizedand unrealizedgain (loss)on investmentsTotal frominvestmentoperationsFromnet investmentincomeTotaldistributionsRedemptionfeesNon-recurringreimbursementsNet asset value,end of periodTotal returnat net assetvalue (% ) bNet assets,end of period(in thousands )RatioRatioof expenses of net investmentto average income (loss)net assets to average(%) c net assets (%)Class A<strong>March</strong> 31, 2014 ** $15.60 .10 k 1.59 1.69 (.23) (.23) — — $17.06 10.91 * $1,327,766 .54* .59* k 56 *September 30, 2013 13.47 .20 2.09 2.29 (.16) (.16) — — 15.60 17.17 1,215,701 1.09 1.38 111September 30, 2012 10.79 .19 2.53 2.72 (.04) (.04) — — 13.47 25.24 1,111,789 1.13 1.51 120September 30, 2011 11.72 .19 (.67) (.48) (.45) (.45) — — e, f 10.79 (4.52) 1,004,060 1.14 1.53 98September 30, 2010 11.03 .20 .98 1.18 (.49) (.49) — e — e,g 11.72 10.98 1,160,684 1.20 1.79 116September 30, 2009 11.30 .19 (.07) .12 (.39) (.39) — e — e,h 11.03 2.31 1,127,303 1.22 i,j 2.09 i 130Class B<strong>March</strong> 31, 2014 ** $15.28 .03 k 1.57 1.60 (.11) (.11) — — $16.77 10.48 * $118,569 .91* .21* k 56 *September 30, 2013 13.19 .09 2.05 2.14 (.05) (.05) — — 15.28 16.28 118,464 1.84 .63 111September 30, 2012 10.60 .09 2.50 2.59 — — — — 13.19 24.43 126,620 1.88 .76 120September 30, 2011 11.52 .09 (.66) (.57) (.35) (.35) — — e, f 10.60 (5.27) 130,730 1.89 .77 98September 30, 2010 10.85 .11 .97 1.08 (.41) (.41) — e — e,g 11.52 10.18 175,341 1.95 1.03 116September 30, 2009 11.05 .12 (.04) .08 (.28) (.28) — e — e,h 10.85 1.64 201,795 1.97 i,j 1.34 i 130Class C<strong>March</strong> 31, 2014 ** $14.94 .03 k 1.54 1.57 (.13) (.13) — — $16.38 10.52 * $161,275 .91* .22* k 56 *September 30, 2013 12.91 .09 2.00 2.09 (.06) (.06) — — 14.94 16.28 144,081 1.84 .62 111September 30, 2012 10.38 .09 2.44 2.53 — — — — 12.91 24.37 127,912 1.88 .77 120September 30, 2011 11.29 .09 (.64) (.55) (.36) (.36) — — e, f 10.38 (5.22) 115,474 1.89 .78 98September 30, 2010 10.66 .11 .93 1.04 (.41) (.41) — e — e,g 11.29 10.05 134,498 1.95 1.04 116September 30, 2009 10.87 .12 (.04) .08 (.29) (.29) — e — e,h 10.66 1.63 134,572 1.97 i,j 1.34 i 130Class M<strong>March</strong> 31, 2014 ** $15.30 .06 k 1.56 1.62 (.16) (.16) — — $16.76 10.61 * $29,917 .78* .34* k 56 *September 30, 2013 13.21 .12 2.06 2.18 (.09) (.09) — — 15.30 16.59 27,200 1.59 .88 111September 30, 2012 10.59 .12 2.50 2.62 — — — — 13.21 24.74 25,303 1.63 1.01 120September 30, 2011 11.52 .13 (.67) (.54) (.39) (.39) — — e, f 10.59 (5.07) 23,402 1.64 1.03 98September 30, 2010 10.86 .14 .96 1.10 (.44) (.44) — e — e,g 11.52 10.41 29,272 1.70 1.28 116September 30, 2009 11.09 .14 (.05) .09 (.32) (.32) — e — e,h 10.86 1.84 29,912 1.72 i,j 1.58 i 130Class R<strong>March</strong> 31, 2014 ** $15.33 .08 k 1.56 1.64 (.19) (.19) — — $16.78 10.76 * $18,184 .66* .47* k 56 *September 30, 2013 13.24 .16 2.06 2.22 (.13) (.13) — — 15.33 16.89 16,026 1.34 1.13 111September 30, 2012 10.60 .15 2.50 2.65 (.01) (.01) — — 13.24 25.00 15,265 1.38 1.26 120September 30, 2011 11.53 .16 (.66) (.50) (.43) (.43) — — e, f 10.60 (4.79) 13,215 1.39 1.29 98September 30, 2010 10.88 .17 .95 1.12 (.47) (.47) — e — e,g 11.53 10.60 13,669 1.45 1.54 116September 30, 2009 11.16 .17 (.08) .09 (.37) (.37) — e — e,h 10.88 1.97 10,844 1.47 i,j 1.85 i 130Class R5<strong>March</strong> 31, 2014 ** $15.76 .13 k 1.60 1.73 (.30) (.30) — — $17.19 11.04 * $6,572 .41* .80* k 56 *September 30, 2013 13.58 .23 2.12 2.35 (.17) (.17) — — 15.76 17.50 64 .82 1.52 111September 30, 2012† 12.78 .06 .74 .80 — — — — 13.58 6.26 * 11 .21* .43* 120Class R6<strong>March</strong> 31, 2014 ** $15.77 .13 k 1.61 1.74 (.29) (.29) — — $17.22 11.12 * $28,509 .36* .78* k 56 *September 30, 2013 13.58 .25 2.12 2.37 (.18) (.18) — — 15.77 17.62 24,534 .72 1.62 111September 30, 2012† 12.78 .06 .74 .80 — — — — 13.58 6.26 * 11 .18* .45* 120Portfolioturnover(% ) dThe accompanying notes are an integral part of these financial statements.98 Dynamic Asset Allocation Growth Fund Dynamic Asset Allocation Growth Fund 99


