OTC CREDIT DEFAULT CONTRACTS OUTSTANDING at 3/31/14 (Unaudited) cont.Swap counterparty/Referenced debt*Rating***Upfrontpremiumreceived(paid)**NotionalamountTerminationdatePaymentsreceived(paid) by fundper annumUnrealizedappreciation/(depreciation)Credit Suisse International cont.CMBX NA — $(4,972 ) $88,000 1/17/47 (300 bp) $(1,784 )BBB– IndexCMBX NA — (5,355) 88,000 1/17/47 (300 bp) (2,168)BBB– IndexCMBX NA — (4,083) 87,000 1/17/47 (300 bp) (932)BBB– IndexCMBX NA — (5,096) 87,000 1/17/47 (300 bp) (1,946)BBB– IndexJPMorgan Chase Bank N.A.EM Series 19 Index BB+/P (66,400) 800,000 6/20/18 500 bp (6,987)Total $24,118 $76,499* Payments related to the referenced debt are made upon a credit default event.** Upfront premium is based on the difference between the original spread on issue and the market spread on dayof execution.*** Ratings are presented for credit default contracts in which the fund has sold protection on the underlyingreferenced debt. Ratings for an underlying index represent the average of the ratings of all the securities includedin that index. The Moody’s, Standard & Poor’s or Fitch ratings are believed to be the most recent ratings availableat <strong>March</strong> 31, 2014. Securities rated by <strong>Putnam</strong> are indicated by “/P.”CENTRALLY CLEARED CREDIT DEFAULT CONTRACTS OUTSTANDING at 3/31/14 (Unaudited)Referenced debt*Rating***Upfrontpremiumreceived(paid)**NotionalamountTerminationdatePaymentsreceived(paid) by fundper annumUnrealizedappreciationNA IG Series 22 BBB+/P $(85,769 ) $5,980,000 6/20/19 100 bp $7,055IndexNA IG Series 22 BBB+/P (70,853) 4,940,000 6/20/19 100 bp 5,828IndexNA IG Series 22 BBB+/P (48,123) 3,400,000 6/20/19 100 bp 4,654IndexNA HY Series 22 B+/P (2,139,303) 30,120,000 6/20/19 500 bp 118,177IndexNA HY Series B+/P (3,031,564) 42,909,000 6/20/19 500 bp 184,44722 IndexNA HY Series B+/P (446,993) 6,206,000 6/20/19 500 bp 18,14422 IndexTotal $(5,822,605 ) $338,305* Payments related to the referenced debt are made upon a credit default event.** Upfront premium is based on the difference between the original spread on issue and the market spread on dayof execution.*** Ratings are presented for credit default contracts in which the fund has sold protection on the underlyingreferenced debt. Ratings for an underlying index represent the average of the ratings of all the securities includedin that index. The Moody’s, Standard & Poor’s or Fitch ratings are believed to be the most recent ratings availableat <strong>March</strong> 31, 2014. Securities rated by <strong>Putnam</strong> are indicated by “/P.”Dynamic Asset Allocation Growth Fund 91
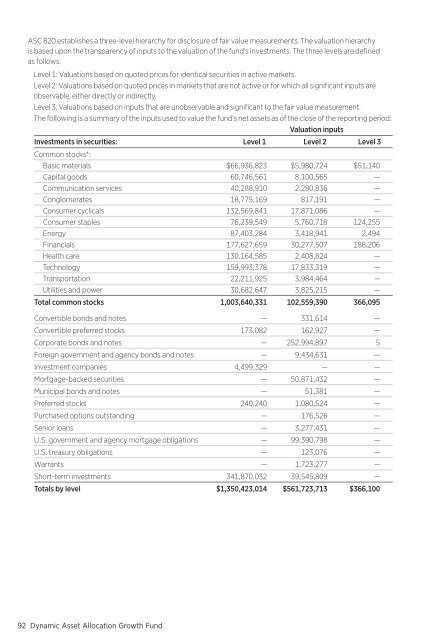
ASC 820 establishes a three-level hierarchy for disclosure of fair value measurements. The valuation hierarchyis based upon the transparency of inputs to the valuation of the fund’s investments. The three levels are definedas follows:Level 1: Valuations based on quoted prices for identical securities in active markets.Level 2: Valuations based on quoted prices in markets that are not active or for which all significant inputs areobservable, either directly or indirectly.Level 3: Valuations based on inputs that are unobservable and significant to the fair value measurement.The following is a summary of the inputs used to value the fund’s net assets as of the close of the reporting period:Valuation inputs<strong>Investments</strong> in securities: Level 1 Level 2 Level 3Common stocks*:Basic materials $66,936,823 $5,980,724 $51,140Capital goods 60,746,561 8,100,565 —Communication services 40,288,910 2,280,836 —Conglomerates 18,775,169 817,191 —Consumer cyclicals 132,569,841 17,871,086 —Consumer staples 76,239,549 5,760,718 124,255Energy 87,403,284 3,418,941 2,494Financials 177,627,659 30,277,507 188,206Health care 130,164,585 2,408,824 —Technology 159,993,378 17,833,319 —Transportation 22,211,925 3,984,464 —Utilities and power 30,682,647 3,825,215 —Total common stocks 1,003,640,331 102,559,390 366,095Convertible bonds and notes — 331,614 —Convertible preferred stocks 173,082 162,927 —Corporate bonds and notes — 252,994,897 5Foreign government and agency bonds and notes — 9,434,631 —Investment companies 4,499,329 — —Mortgage-backed securities — 50,871,432 —Municipal bonds and notes — 51,381 —Preferred stocks 240,240 1,080,524 —Purchased options outstanding — 176,526 —Senior loans — 3,277,431 —U.S. government and agency mortgage obligations — 99,390,798 —U.S. treasury obligations — 123,076 —Warrants — 1,723,277 —Short-term investments 341,870,032 39,545,809 —Totals by level $1,350,423,014 $561,723,713 $366,10092 Dynamic Asset Allocation Growth Fund