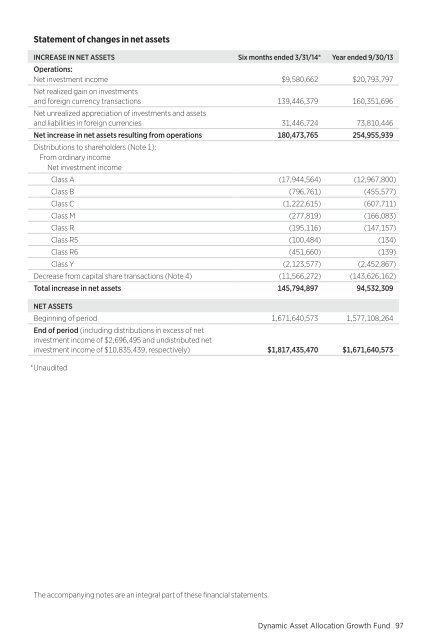
Statement of changes in net assetsINCREASE IN NET ASSETS Six months ended 3/31/14* Year ended 9/30/13Operations:Net investment income $9,580,662 $20,793,797Net realized gain on investmentsand foreign currency transactions 139,446,379 160,351,696Net unrealized appreciation of investments and assetsand liabilities in foreign currencies 31,446,724 73,810,446Net increase in net assets resulting from operations 180,473,765 254,955,939Distributions to shareholders (Note 1):From ordinary incomeNet investment incomeClass A (17,944,564) (12,967,800)Class B (796,761) (455,577)Class C (1,222,615) (607,711)Class M (277,819) (166,083)Class R (195,116) (147,157)Class R5 (100,484) (134)Class R6 (451,660) (139)Class Y (2,123,577) (2,452,867)Decrease from capital share transactions (Note 4) (11,566,272) (143,626,162)Total increase in net assets 145,794,897 94,532,309NET ASSETSBeginning of period 1,671,640,573 1,577,108,264End of period (including distributions in excess of netinvestment income of $2,696,495 and undistributed netinvestment income of $10,835,439, respectively) $1,817,435,470 $1,671,640,573*UnauditedThe accompanying notes are an integral part of these financial statements.Dynamic Asset Allocation Growth Fund 97
Financial highlights (For a common share outstanding throughout the period)INVESTMENT OPERATIONS: LESS DISTRIBUTIONS: RATIOS AND SUPPLEMENTAL DATA:Period endedNet asset value,beginningof periodNet investmentincome (loss ) aSee notes to financial highlights at the end of this section.Net realizedand unrealizedgain (loss)on investmentsTotal frominvestmentoperationsFromnet investmentincomeTotaldistributionsRedemptionfeesNon-recurringreimbursementsNet asset value,end of periodTotal returnat net assetvalue (% ) bNet assets,end of period(in thousands )RatioRatioof expenses of net investmentto average income (loss)net assets to average(%) c net assets (%)Class A<strong>March</strong> 31, 2014 ** $15.60 .10 k 1.59 1.69 (.23) (.23) — — $17.06 10.91 * $1,327,766 .54* .59* k 56 *September 30, 2013 13.47 .20 2.09 2.29 (.16) (.16) — — 15.60 17.17 1,215,701 1.09 1.38 111September 30, 2012 10.79 .19 2.53 2.72 (.04) (.04) — — 13.47 25.24 1,111,789 1.13 1.51 120September 30, 2011 11.72 .19 (.67) (.48) (.45) (.45) — — e, f 10.79 (4.52) 1,004,060 1.14 1.53 98September 30, 2010 11.03 .20 .98 1.18 (.49) (.49) — e — e,g 11.72 10.98 1,160,684 1.20 1.79 116September 30, 2009 11.30 .19 (.07) .12 (.39) (.39) — e — e,h 11.03 2.31 1,127,303 1.22 i,j 2.09 i 130Class B<strong>March</strong> 31, 2014 ** $15.28 .03 k 1.57 1.60 (.11) (.11) — — $16.77 10.48 * $118,569 .91* .21* k 56 *September 30, 2013 13.19 .09 2.05 2.14 (.05) (.05) — — 15.28 16.28 118,464 1.84 .63 111September 30, 2012 10.60 .09 2.50 2.59 — — — — 13.19 24.43 126,620 1.88 .76 120September 30, 2011 11.52 .09 (.66) (.57) (.35) (.35) — — e, f 10.60 (5.27) 130,730 1.89 .77 98September 30, 2010 10.85 .11 .97 1.08 (.41) (.41) — e — e,g 11.52 10.18 175,341 1.95 1.03 116September 30, 2009 11.05 .12 (.04) .08 (.28) (.28) — e — e,h 10.85 1.64 201,795 1.97 i,j 1.34 i 130Class C<strong>March</strong> 31, 2014 ** $14.94 .03 k 1.54 1.57 (.13) (.13) — — $16.38 10.52 * $161,275 .91* .22* k 56 *September 30, 2013 12.91 .09 2.00 2.09 (.06) (.06) — — 14.94 16.28 144,081 1.84 .62 111September 30, 2012 10.38 .09 2.44 2.53 — — — — 12.91 24.37 127,912 1.88 .77 120September 30, 2011 11.29 .09 (.64) (.55) (.36) (.36) — — e, f 10.38 (5.22) 115,474 1.89 .78 98September 30, 2010 10.66 .11 .93 1.04 (.41) (.41) — e — e,g 11.29 10.05 134,498 1.95 1.04 116September 30, 2009 10.87 .12 (.04) .08 (.29) (.29) — e — e,h 10.66 1.63 134,572 1.97 i,j 1.34 i 130Class M<strong>March</strong> 31, 2014 ** $15.30 .06 k 1.56 1.62 (.16) (.16) — — $16.76 10.61 * $29,917 .78* .34* k 56 *September 30, 2013 13.21 .12 2.06 2.18 (.09) (.09) — — 15.30 16.59 27,200 1.59 .88 111September 30, 2012 10.59 .12 2.50 2.62 — — — — 13.21 24.74 25,303 1.63 1.01 120September 30, 2011 11.52 .13 (.67) (.54) (.39) (.39) — — e, f 10.59 (5.07) 23,402 1.64 1.03 98September 30, 2010 10.86 .14 .96 1.10 (.44) (.44) — e — e,g 11.52 10.41 29,272 1.70 1.28 116September 30, 2009 11.09 .14 (.05) .09 (.32) (.32) — e — e,h 10.86 1.84 29,912 1.72 i,j 1.58 i 130Class R<strong>March</strong> 31, 2014 ** $15.33 .08 k 1.56 1.64 (.19) (.19) — — $16.78 10.76 * $18,184 .66* .47* k 56 *September 30, 2013 13.24 .16 2.06 2.22 (.13) (.13) — — 15.33 16.89 16,026 1.34 1.13 111September 30, 2012 10.60 .15 2.50 2.65 (.01) (.01) — — 13.24 25.00 15,265 1.38 1.26 120September 30, 2011 11.53 .16 (.66) (.50) (.43) (.43) — — e, f 10.60 (4.79) 13,215 1.39 1.29 98September 30, 2010 10.88 .17 .95 1.12 (.47) (.47) — e — e,g 11.53 10.60 13,669 1.45 1.54 116September 30, 2009 11.16 .17 (.08) .09 (.37) (.37) — e — e,h 10.88 1.97 10,844 1.47 i,j 1.85 i 130Class R5<strong>March</strong> 31, 2014 ** $15.76 .13 k 1.60 1.73 (.30) (.30) — — $17.19 11.04 * $6,572 .41* .80* k 56 *September 30, 2013 13.58 .23 2.12 2.35 (.17) (.17) — — 15.76 17.50 64 .82 1.52 111September 30, 2012† 12.78 .06 .74 .80 — — — — 13.58 6.26 * 11 .21* .43* 120Class R6<strong>March</strong> 31, 2014 ** $15.77 .13 k 1.61 1.74 (.29) (.29) — — $17.22 11.12 * $28,509 .36* .78* k 56 *September 30, 2013 13.58 .25 2.12 2.37 (.18) (.18) — — 15.77 17.62 24,534 .72 1.62 111September 30, 2012† 12.78 .06 .74 .80 — — — — 13.58 6.26 * 11 .18* .45* 120Portfolioturnover(% ) dThe accompanying notes are an integral part of these financial statements.98 Dynamic Asset Allocation Growth Fund Dynamic Asset Allocation Growth Fund 99