“willingness-to-pay” for birding, hunting, educational opportunities). And, lastly, the ecosystem thatgenerates the greatest value may not result in a distribution <strong>of</strong> benefits considered equitable (e.g.,opportunities for rich compared to. poor or urban compared to. rural).Second, there are significant differences in the attributes <strong>of</strong> ecosystems that allow them toprovide different types <strong>of</strong> ecosystem functions and services. Box 7.2 provides a list <strong>of</strong> the mostfrequently cited ecosystem services. Some <strong>of</strong> these are provided best by ecosystems that are locatedaway from people and are surrounded by undisturbed natural landscapes (e.g., endangered specieshabitats). Others require that the ecosystem be relatively close to people (e.g., educational andrecreational opportunities, flood damage prevention, aesthetics). Similarly, some services, such asthose associated with sediment, nutrient, or contaminant trapping, are provided only if the ecosystemis located near disturbed landscapes where run<strong>of</strong>f is a problem. Others, such as breeding habitat formigratory waterfowl, are provided more effectively at sites in undisturbed landscapes. Unless thefactors affecting the various functions, services, and values <strong>of</strong> an ecosystem are considered separately,it is impossible to compare ecosystems with similar features in terms <strong>of</strong> specific or overall measures <strong>of</strong>value.The third and most important reason for distinguishing between these terms is that mostwidely used analytical methods for assessing and comparing ecosystems do not focus on thebiophysical or socio-economic linkages that are necessary for an ecosystem to contribute to humanwelfare. Standard ecosystem assessment methods were developed primarily by scientists and evolvedas extensions <strong>of</strong> morphological studies — studies <strong>of</strong> the form and structure <strong>of</strong> biological systems. 31They focus on ecosystem features and usually employ indicators that refer to an ecosystem’sbiophysical capacity to provide functions. Many <strong>of</strong> them refer to functional values or value indiceswhen describing functional capacity, but they rarely address outcomes related to services or values asthe terms are defined in Box 7.1.Ecosystem valuation methods, on the other hand, have been developed primarily byeconomists and are limited in scope at the opposite extreme. They attempt to assign values toecosystem services, usually in absolute (dollar) terms, without much regard for the specific ecosystemfeatures or functions that generated them. 32The fact that many ecosystem services generate <strong>of</strong>f-sitebenefits that are difficult to trace and measure and result primarily in non-marketed benefits makethem extremely difficult and expensive to measure and trace back to specific ecosystems. Themethods that must be used are usually too expensive to be applied to the full range <strong>of</strong> ecosystemservices and, to date, have been applied to only a small sub-set <strong>of</strong> them. The following sectionprovides a critical overview <strong>of</strong> dollar-based ecosystem valuation methods and outlines the need for analternative.3132The most comprehensive ecosystem assessment methods are those developed for wetlands. Most <strong>of</strong>these result in numerical indicators <strong>of</strong> specific wetland functions. Some are used to “score” wetlandtrades and to assess the success <strong>of</strong> wetland restoration. A recent review <strong>of</strong> these methods is providedin Bartoldus (1999).Several recent textbooks outline non-market methods <strong>of</strong> assigning value to ecosystem services anddiscuss the practical problems <strong>of</strong> applying the methods usefully. In particular, see Smith (1996) andBateman and Willis (1999).124
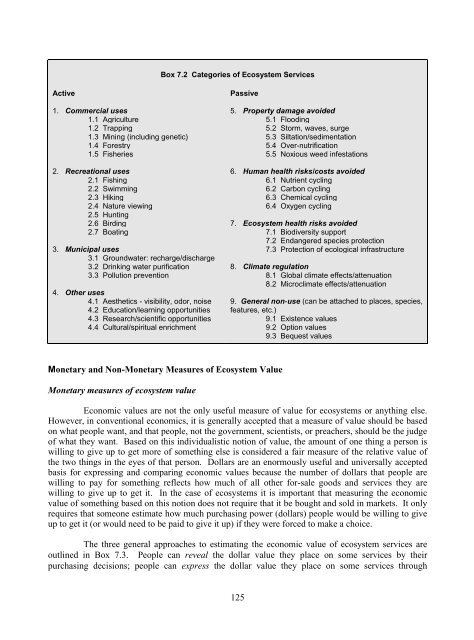
Box 7.2 Categories <strong>of</strong> Ecosystem ServicesActive1. Commercial uses1.1 Agriculture1.2 Trapping1.3 Mining (including genetic)1.4 Forestry1.5 Fisheries2. Recreational uses2.1 Fishing2.2 Swimming2.3 Hiking2.4 Nature viewing2.5 Hunting2.6 Birding2.7 Boating3. Municipal uses3.1 Groundwater: recharge/discharge3.2 Drinking water purification3.3 Pollution prevention4. Other uses4.1 Aesthetics - visibility, odor, noise4.2 Education/learning opportunities4.3 Research/scientific opportunities4.4 Cultural/spiritual enrichmentPassive5. Property damage avoided5.1 Flooding5.2 Storm, waves, surge5.3 Siltation/sedimentation5.4 Over-nutrification5.5 Noxious weed infestations6. Human health risks/costs avoided6.1 Nutrient cycling6.2 Carbon cycling6.3 Chemical cycling6.4 Oxygen cycling7. Ecosystem health risks avoided7.1 <strong>Biodiversity</strong> support7.2 Endangered species protection7.3 Protection <strong>of</strong> ecological infrastructure8. Climate regulation8.1 Global climate effects/attenuation8.2 Microclimate effects/attenuation9. General non-use (can be attached to places, species,features, etc.)9.1 Existence values9.2 Option values9.3 Bequest valuesMonetary and Non-Monetary Measures <strong>of</strong> Ecosystem ValueMonetary measures <strong>of</strong> ecosystem valueEconomic values are not the only useful measure <strong>of</strong> value for ecosystems or anything else.However, in conventional economics, it is generally accepted that a measure <strong>of</strong> value should be basedon what people want, and that people, not the government, scientists, or preachers, should be the judge<strong>of</strong> what they want. Based on this individualistic notion <strong>of</strong> value, the amount <strong>of</strong> one thing a person iswilling to give up to get more <strong>of</strong> something else is considered a fair measure <strong>of</strong> the relative value <strong>of</strong>the two things in the eyes <strong>of</strong> that person. Dollars are an enormously useful and universally acceptedbasis for expressing and comparing economic values because the number <strong>of</strong> dollars that people arewilling to pay for something reflects how much <strong>of</strong> all other for-sale goods and services they arewilling to give up to get it. In the case <strong>of</strong> ecosystems it is important that measuring the economicvalue <strong>of</strong> something based on this notion does not require that it be bought and sold in markets. It onlyrequires that someone estimate how much purchasing power (dollars) people would be willing to giveup to get it (or would need to be paid to give it up) if they were forced to make a choice.The three general approaches to estimating the economic value <strong>of</strong> ecosystem services areoutlined in Box 7.3. People can reveal the dollar value they place on some services by theirpurchasing decisions; people can express the dollar value they place on some services through125
- Page 1 and 2:
«ENVIRONMENTValuation ofBiodiversi
- Page 3 and 4:
ORGANISATION FOR ECONOMIC CO-OPERAT
- Page 5 and 6:
TABLE OF CONTENTSPART 1 ...........
- Page 7 and 8:
PART 4 ............................
- Page 10 and 11:
Why value biodiversity?There are th
- Page 12 and 13:
Figure 1.1 Total economic value: us
- Page 14 and 15:
from biodiversity at the local leve
- Page 16 and 17:
in the database and also for undert
- Page 18 and 19:
in the policy context. This is high
- Page 20:
Table 1.3 Policy Options for the Cl
- Page 23 and 24:
Box 1.2 Value of Turkey’s Forests
- Page 25 and 26:
of the most important implications
- Page 27 and 28:
Additionally, valuation does not ju
- Page 29 and 30:
value is the habitat, many differen
- Page 31 and 32:
are very modest. More recently, new
- Page 33 and 34:
Table 2.2 Estimates of the Medicina
- Page 35 and 36:
The importance of indirect use valu
- Page 37 and 38:
pharmaceutical use, although the li
- Page 39 and 40:
McAllister, D., (1991). Estimating
- Page 41 and 42:
Simpson, D and Craft, A.. (1996).
- Page 43 and 44:
practice, the overlap between these
- Page 45 and 46:
aimed at giving more precise quanti
- Page 47 and 48:
structural values. There are a numb
- Page 49 and 50:
Reid (forthcoming) discusses the po
- Page 51 and 52:
Ecotourism as a Way to Generate Loc
- Page 53 and 54:
endangered Indian rhino and other t
- Page 55 and 56:
ReferencesBann, C., and M. Clemens
- Page 57 and 58:
PART 261
- Page 59 and 60:
many European countries, CBA has a
- Page 61 and 62:
(1) Cost and time constraintsThe co
- Page 63 and 64:
activity day, there is greater vari
- Page 65 and 66: added independent variable C s= cha
- Page 67 and 68: error in valuing respiratory sympto
- Page 69 and 70: ReferencesArrow, K.J., R. Solow, E.
- Page 71 and 72: OECD (1995). The Economic Appraisal
- Page 73 and 74: CHAPTER 5:by José Manuel LIMA E SA
- Page 75 and 76: linkages usually lead to diverse co
- Page 77 and 78: A discrete choice approach to quest
- Page 79 and 80: Table 5.2 Model-based point estimat
- Page 81 and 82: is potentially very large for multi
- Page 83 and 84: P3 is already in the mix is 2.51, s
- Page 85 and 86: PART 391
- Page 87 and 88: measures of value. An appendix to t
- Page 89 and 90: features (such as parks, beaches or
- Page 91 and 92: included in cost-benefit analysis o
- Page 93 and 94: A Discussion of Past Efforts to Dev
- Page 95 and 96: Satellite AccountsIn addition to th
- Page 97 and 98: which many people argue are associa
- Page 99 and 100: approach to competing uses of water
- Page 101 and 102: Figure 6.2 Trade-Off AnalysisEnviro
- Page 103 and 104: However, the farmers need not bear
- Page 105 and 106: Appendix 1: Theory and Application
- Page 107 and 108: iwhere C is the income adjustment n
- Page 109 and 110: complete. If there are more than on
- Page 111 and 112: Horowitz, Joel. L. and Jordan. J. L
- Page 113 and 114: CHAPTER 7:by Dennis M. KING and Lis
- Page 115: Box 7.1 Definition of terms related
- Page 119 and 120: Box 7.4 Dollar-based ecosystem valu
- Page 121 and 122: Non-monetary indicators of ecosyste
- Page 123 and 124: Figure 7.1 Effects of Wetland Locat
- Page 125 and 126: description, and that the usefulnes
- Page 127 and 128: 2) Service capacity sub-indexIndica
- Page 129 and 130: wetlands, for example, results in F
- Page 131 and 132: (1) Functional CapacityIndexFigure
- Page 133 and 134: constituents of runoff can be predi
- Page 135 and 136: Service(on or off site)Recreational
- Page 137 and 138: Table 7.3 Service Risk Sub-index De
- Page 139 and 140: Measuring Service Preference Weight
- Page 141 and 142: Table 7.4 Illustration of Paired Co
- Page 143 and 144: PART 4151
- Page 145 and 146: Ecological foundations for biodiver
- Page 147 and 148: Phenotic diversity is a measure bas
- Page 149 and 150: Operationalisation of the biotic-ri
- Page 151 and 152: ten attributes that could score a m
- Page 153 and 154: The choice of the scale relates to
- Page 155 and 156: Nature measurement methodIn 1995, t
- Page 157 and 158: Table 8.4 Value orientations and en
- Page 159 and 160: Table 8.5 Identification of monetar
- Page 161 and 162: Table 8.6 Valuation studiesSingle s
- Page 163 and 164: in waterway systems for nine impact
- Page 165 and 166: to other contexts, conditions, loca
- Page 167 and 168:
ReferencesAkcakaya, H.R. (1994).
- Page 169 and 170:
de Groot, R.S. (1994). “Environme
- Page 171 and 172:
Mace, G. M. & S. N. Stuart. (1994).
- Page 173 and 174:
Turner, R.K., Perrings, C. and Folk
- Page 175 and 176:
John A. DixonJohn A. Dixon is Lead
- Page 177 and 178:
Robert O’NeillDr. O’Neill recei
- Page 179 and 180:
Steven StewartSteven Stewart is Ass
- Page 181:
OECD PUBLICATIONS, 2, rue André-Pa