What then is the economic value <strong>of</strong> diversity in this broader sense? If diversity is critical toecosystem functioning, albeit in an uncertain fashion, then reduced diversity reduces the probabilitythat the ecosystem will survive. Its functions will then be lost. Hence the value <strong>of</strong> diversity can beapproximated by the value <strong>of</strong> the functions <strong>of</strong> the ecosystem. The kinds <strong>of</strong> values estimated for theThai mangrove system would then be relevant: loss <strong>of</strong> local, indirect, and global values. If this iscorrect, analysing the value <strong>of</strong> the functions <strong>of</strong> ecosystems amounts to conferring a value on diversity.But, uncertainty makes it difficult to know if measuring the value <strong>of</strong> these functions amounts to acomplete coverage <strong>of</strong> the value <strong>of</strong> biodiversity. Given the context <strong>of</strong> uncertainty, conservation <strong>of</strong>diversity may have a value greater than the values that can be assigned to the ‘outputs’ that theecosystem produces. To some extent these additional values are captured in the idea <strong>of</strong> option value,the value <strong>of</strong> conserving diversity because we may wish to make use <strong>of</strong> its beneficial effects in thefuture, and quasi-option value, the value <strong>of</strong> any information that might accrue by maintaining diversityrather than sacrificing it now.The pervasiveness <strong>of</strong> the uncertainty about the value <strong>of</strong> diversity suggests two things:- First, that, while placing economic values on the functions that we can value is essential,that activity may not capture the ‘total’ or ‘true’ economic value <strong>of</strong> diversity. Unless wehave a better feel for option-type values, our valuation is incomplete; and- Second, we should be cautious about sacrificing diversity.The ‘precaution’ in the second implication needs further explanation. A traditionalcost-benefit analysis has the capacity to incorporate a good deal <strong>of</strong> our concerns about uncertainty. Forexample, it is possible to introduce probabilities, if they are known, and work with expected valuesrather than certain values. If probabilities are known, we can also build risk aversion into the picture,i.e. we can weight quite heavily the losses that might occur if diversity is lost. But the problem withthis expected value approach (or expected utility approach where risk aversion is incorporated) is thatthe probabilities tend not to be known. We have pure uncertainty. Cost-benefit analysis is lessadaptable in this case and some authors have argued for use <strong>of</strong> the safe minimum standards approach(SMS) in such contexts. Under SMS there is a presumption in favour <strong>of</strong> conservation unless theopportunity costs are ‘high’ [Bishop (1978)]. Arguably, as people are better and better informed aboutthe value <strong>of</strong> diversity, i.e. as we learn more and disseminate that learning, so the SMS approach willapproximate a cost-benefit approach, because people’s preferences will be better informed. In themeantime, SMS is intuitively attractive because it forces us to ask whether we are really sure that thebenefits <strong>of</strong> sacrificing diversity are ‘high’. The problem remains, <strong>of</strong> course, that we have to be clear onwhat we mean by ‘unacceptably high’ costs.Indirect global use values: ecosystem servicesThe kinds <strong>of</strong> services that ecosystems provide include the protection <strong>of</strong> watersheds, climateregulation, waste assimilation, and nutrient cycling. Many <strong>of</strong> the benefits <strong>of</strong> these ecosystem functionsaccrue locally, and do not therefore appear to be <strong>of</strong> global significance. But since all living organismsdepend on these functions, there is a real sense in which the local benefits contribute to an overallglobal benefit. Barbier (1994) classifies these ecosystem functions as regulation, production, carrier,and information functions. Regulatory functions include the regulation <strong>of</strong> climate, water flow, wasteflows, and nutrients. Production functions refer to the useful outputs <strong>of</strong> ecosystems, such as water andfuel. Carrier functions relate to the support roles that ecosystems have for recreation, industry, fishing,agriculture, etc. Finally, information functions relate to aesthetic, cultural and scientific benefits.37
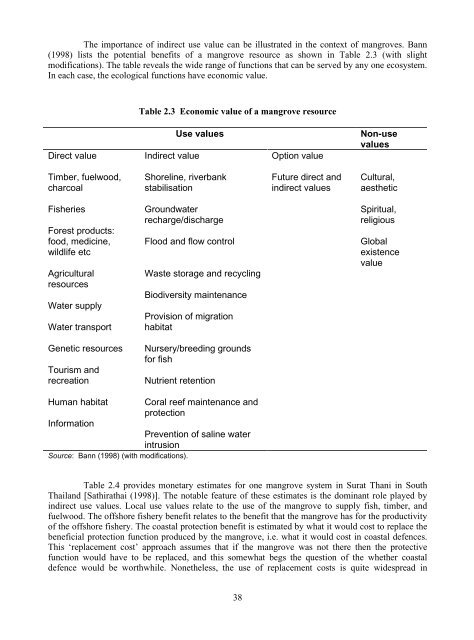
The importance <strong>of</strong> indirect use value can be illustrated in the context <strong>of</strong> mangroves. Bann(1998) lists the potential benefits <strong>of</strong> a mangrove resource as shown in Table 2.3 (with slightmodifications). The table reveals the wide range <strong>of</strong> functions that can be served by any one ecosystem.In each case, the ecological functions have economic value.Table 2.3 Economic value <strong>of</strong> a mangrove resourceUse valuesDirect value Indirect value Option valueNon-usevaluesTimber, fuelwood,charcoalShoreline, riverbankstabilisationFuture direct andindirect valuesCultural,aestheticFisheriesForest products:food, medicine,wildlife etcAgriculturalresourcesWater supplyWater transportGroundwaterrecharge/dischargeFlood and flow controlWaste storage and recycling<strong>Biodiversity</strong> maintenanceProvision <strong>of</strong> migrationhabitatSpiritual,religiousGlobalexistencevalueGenetic resourcesTourism andrecreationNursery/breeding groundsfor fishNutrient retentionHuman habitatInformationSource: Bann (1998) (with modifications).Coral reef maintenance andprotectionPrevention <strong>of</strong> saline waterintrusionTable 2.4 provides monetary estimates for one mangrove system in Surat Thani in SouthThailand [Sathirathai (1998)]. The notable feature <strong>of</strong> these estimates is the dominant role played byindirect use values. Local use values relate to the use <strong>of</strong> the mangrove to supply fish, timber, andfuelwood. The <strong>of</strong>fshore fishery benefit relates to the benefit that the mangrove has for the productivity<strong>of</strong> the <strong>of</strong>fshore fishery. The coastal protection benefit is estimated by what it would cost to replace thebeneficial protection function produced by the mangrove, i.e. what it would cost in coastal defences.This ‘replacement cost’ approach assumes that if the mangrove was not there then the protectivefunction would have to be replaced, and this somewhat begs the question <strong>of</strong> the whether coastaldefence would be worthwhile. Nonetheless, the use <strong>of</strong> replacement costs is quite widespread in38
- Page 1 and 2: «ENVIRONMENTValuation ofBiodiversi
- Page 3 and 4: ORGANISATION FOR ECONOMIC CO-OPERAT
- Page 5 and 6: TABLE OF CONTENTSPART 1 ...........
- Page 7 and 8: PART 4 ............................
- Page 10 and 11: Why value biodiversity?There are th
- Page 12 and 13: Figure 1.1 Total economic value: us
- Page 14 and 15: from biodiversity at the local leve
- Page 16 and 17: in the database and also for undert
- Page 18 and 19: in the policy context. This is high
- Page 20: Table 1.3 Policy Options for the Cl
- Page 23 and 24: Box 1.2 Value of Turkey’s Forests
- Page 25 and 26: of the most important implications
- Page 27 and 28: Additionally, valuation does not ju
- Page 29 and 30: value is the habitat, many differen
- Page 31 and 32: are very modest. More recently, new
- Page 33: Table 2.2 Estimates of the Medicina
- Page 37 and 38: pharmaceutical use, although the li
- Page 39 and 40: McAllister, D., (1991). Estimating
- Page 41 and 42: Simpson, D and Craft, A.. (1996).
- Page 43 and 44: practice, the overlap between these
- Page 45 and 46: aimed at giving more precise quanti
- Page 47 and 48: structural values. There are a numb
- Page 49 and 50: Reid (forthcoming) discusses the po
- Page 51 and 52: Ecotourism as a Way to Generate Loc
- Page 53 and 54: endangered Indian rhino and other t
- Page 55 and 56: ReferencesBann, C., and M. Clemens
- Page 57 and 58: PART 261
- Page 59 and 60: many European countries, CBA has a
- Page 61 and 62: (1) Cost and time constraintsThe co
- Page 63 and 64: activity day, there is greater vari
- Page 65 and 66: added independent variable C s= cha
- Page 67 and 68: error in valuing respiratory sympto
- Page 69 and 70: ReferencesArrow, K.J., R. Solow, E.
- Page 71 and 72: OECD (1995). The Economic Appraisal
- Page 73 and 74: CHAPTER 5:by José Manuel LIMA E SA
- Page 75 and 76: linkages usually lead to diverse co
- Page 77 and 78: A discrete choice approach to quest
- Page 79 and 80: Table 5.2 Model-based point estimat
- Page 81 and 82: is potentially very large for multi
- Page 83 and 84: P3 is already in the mix is 2.51, s
- Page 85 and 86:
PART 391
- Page 87 and 88:
measures of value. An appendix to t
- Page 89 and 90:
features (such as parks, beaches or
- Page 91 and 92:
included in cost-benefit analysis o
- Page 93 and 94:
A Discussion of Past Efforts to Dev
- Page 95 and 96:
Satellite AccountsIn addition to th
- Page 97 and 98:
which many people argue are associa
- Page 99 and 100:
approach to competing uses of water
- Page 101 and 102:
Figure 6.2 Trade-Off AnalysisEnviro
- Page 103 and 104:
However, the farmers need not bear
- Page 105 and 106:
Appendix 1: Theory and Application
- Page 107 and 108:
iwhere C is the income adjustment n
- Page 109 and 110:
complete. If there are more than on
- Page 111 and 112:
Horowitz, Joel. L. and Jordan. J. L
- Page 113 and 114:
CHAPTER 7:by Dennis M. KING and Lis
- Page 115 and 116:
Box 7.1 Definition of terms related
- Page 117 and 118:
Box 7.2 Categories of Ecosystem Ser
- Page 119 and 120:
Box 7.4 Dollar-based ecosystem valu
- Page 121 and 122:
Non-monetary indicators of ecosyste
- Page 123 and 124:
Figure 7.1 Effects of Wetland Locat
- Page 125 and 126:
description, and that the usefulnes
- Page 127 and 128:
2) Service capacity sub-indexIndica
- Page 129 and 130:
wetlands, for example, results in F
- Page 131 and 132:
(1) Functional CapacityIndexFigure
- Page 133 and 134:
constituents of runoff can be predi
- Page 135 and 136:
Service(on or off site)Recreational
- Page 137 and 138:
Table 7.3 Service Risk Sub-index De
- Page 139 and 140:
Measuring Service Preference Weight
- Page 141 and 142:
Table 7.4 Illustration of Paired Co
- Page 143 and 144:
PART 4151
- Page 145 and 146:
Ecological foundations for biodiver
- Page 147 and 148:
Phenotic diversity is a measure bas
- Page 149 and 150:
Operationalisation of the biotic-ri
- Page 151 and 152:
ten attributes that could score a m
- Page 153 and 154:
The choice of the scale relates to
- Page 155 and 156:
Nature measurement methodIn 1995, t
- Page 157 and 158:
Table 8.4 Value orientations and en
- Page 159 and 160:
Table 8.5 Identification of monetar
- Page 161 and 162:
Table 8.6 Valuation studiesSingle s
- Page 163 and 164:
in waterway systems for nine impact
- Page 165 and 166:
to other contexts, conditions, loca
- Page 167 and 168:
ReferencesAkcakaya, H.R. (1994).
- Page 169 and 170:
de Groot, R.S. (1994). “Environme
- Page 171 and 172:
Mace, G. M. & S. N. Stuart. (1994).
- Page 173 and 174:
Turner, R.K., Perrings, C. and Folk
- Page 175 and 176:
John A. DixonJohn A. Dixon is Lead
- Page 177 and 178:
Robert O’NeillDr. O’Neill recei
- Page 179 and 180:
Steven StewartSteven Stewart is Ass
- Page 181:
OECD PUBLICATIONS, 2, rue André-Pa