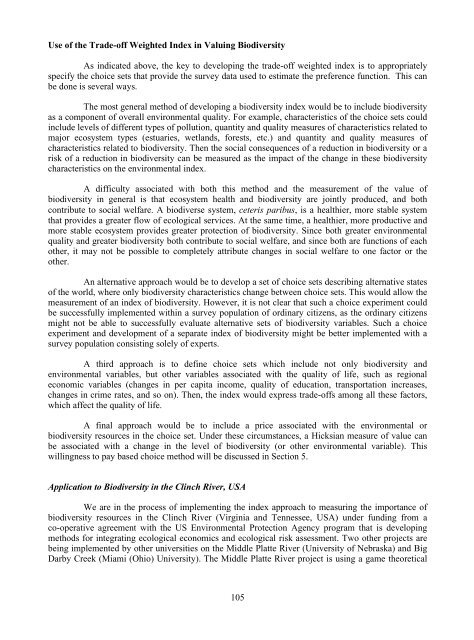
Use <strong>of</strong> the Trade-<strong>of</strong>f Weighted Index in Valuing <strong>Biodiversity</strong>As indicated above, the key to developing the trade-<strong>of</strong>f weighted index is to appropriatelyspecify the choice sets that provide the survey data used to estimate the preference function. This canbe done is several ways.The most general method <strong>of</strong> developing a biodiversity index would be to include biodiversityas a component <strong>of</strong> overall environmental quality. For example, characteristics <strong>of</strong> the choice sets couldinclude levels <strong>of</strong> different types <strong>of</strong> pollution, quantity and quality measures <strong>of</strong> characteristics related tomajor ecosystem types (estuaries, wetlands, forests, etc.) and quantity and quality measures <strong>of</strong>characteristics related to biodiversity. Then the social consequences <strong>of</strong> a reduction in biodiversity or arisk <strong>of</strong> a reduction in biodiversity can be measured as the impact <strong>of</strong> the change in these biodiversitycharacteristics on the environmental index.A difficulty associated with both this method and the measurement <strong>of</strong> the value <strong>of</strong>biodiversity in general is that ecosystem health and biodiversity are jointly produced, and bothcontribute to social welfare. A biodiverse system, ceteris paribus, is a healthier, more stable systemthat provides a greater flow <strong>of</strong> ecological services. At the same time, a healthier, more productive andmore stable ecosystem provides greater protection <strong>of</strong> biodiversity. Since both greater environmentalquality and greater biodiversity both contribute to social welfare, and since both are functions <strong>of</strong> eachother, it may not be possible to completely attribute changes in social welfare to one factor or theother.An alternative approach would be to develop a set <strong>of</strong> choice sets describing alternative states<strong>of</strong> the world, where only biodiversity characteristics change between choice sets. This would allow themeasurement <strong>of</strong> an index <strong>of</strong> biodiversity. However, it is not clear that such a choice experiment couldbe successfully implemented within a survey population <strong>of</strong> ordinary citizens, as the ordinary citizensmight not be able to successfully evaluate alternative sets <strong>of</strong> biodiversity variables. Such a choiceexperiment and development <strong>of</strong> a separate index <strong>of</strong> biodiversity might be better implemented with asurvey population consisting solely <strong>of</strong> experts.A third approach is to define choice sets which include not only biodiversity andenvironmental variables, but other variables associated with the quality <strong>of</strong> life, such as regionaleconomic variables (changes in per capita income, quality <strong>of</strong> education, transportation increases,changes in crime rates, and so on). Then, the index would express trade-<strong>of</strong>fs among all these factors,which affect the quality <strong>of</strong> life.A final approach would be to include a price associated with the environmental orbiodiversity resources in the choice set. Under these circumstances, a Hicksian measure <strong>of</strong> value canbe associated with a change in the level <strong>of</strong> biodiversity (or other environmental variable). Thiswillingness to pay based choice method will be discussed in Section 5.Application to <strong>Biodiversity</strong> in the Clinch River, USAWe are in the process <strong>of</strong> implementing the index approach to measuring the importance <strong>of</strong>biodiversity resources in the Clinch River (Virginia and Tennessee, USA) under funding from aco-operative agreement with the US Environmental Protection Agency program that is developingmethods for integrating ecological economics and ecological risk assessment. Two other projects arebeing implemented by other universities on the Middle Platte River (University <strong>of</strong> Nebraska) and BigDarby Creek (Miami (Ohio) University). The Middle Platte River project is using a game theoretical105
approach to competing uses <strong>of</strong> water resources, while the Big Darby Creek project is using hedonicpricing methods and contingent valuation.Since the objective <strong>of</strong> this research program is to integrate economic analysis and ecologicalrisk assessment, our planned empirical research will not focus on a pure biodiversity index, becausesuch an index will not allow a broad examination <strong>of</strong> people’s willingness to make trade-<strong>of</strong>fs <strong>of</strong>biodiversity for other aspects <strong>of</strong> the quality <strong>of</strong> life. Instead, we will focus on the other two indexmethods (all environmental variables in the choice sets and a set <strong>of</strong> environmental and quality <strong>of</strong> lifevariables in the choice set). In addition, a set <strong>of</strong> surveys will be conducted where the choice setsinclude a tax price, so that willingness to pay measures can be derived.The Clinch River is remarkable in that it contains a great diversity <strong>of</strong> freshwater mussel andfish species. However, the abundance and biodiversity <strong>of</strong> both the mussels and fish are threatened bythe changes in environmental quality resulting from coal mining, deforestation <strong>of</strong> the riparian corridor,cattle ranching, crop cultivation, chemical spills and run <strong>of</strong>f from highways and construction areas.One complication in the valuation process is that the mussels affect social welfare in a veryindirect path. They provide few direct ecological services (even their role in filtration is <strong>of</strong> limitedimportance) but they represent a unique reservoir <strong>of</strong> freshwater mussel species. 24In addition, themussels serve as an indicator species. Since mussels are immobile (as adults), they are located in thesediments, and they filter water to attain sustenance, they are very vulnerable to changes inenvironmental quality.Since the connection to individual utility is indirect, our surveys must first describe thesignificance <strong>of</strong> the mussel populations and biodiversity, its role in the uniqueness and character <strong>of</strong> thesystem, and its role as a biodiversity reserve in North America and the world. Of course, any time aninformational process is part <strong>of</strong> the survey technique, there is a danger that the surveyors are creatingvalue rather than measuring value.The first set <strong>of</strong> choice sets involve only environmental characteristics. Choice sets willinvolve characteristics associated with water quality, mussel abundance, mussel biodiversity, quality<strong>of</strong> fresh water fishing (predominantly smallmouth bass), landscape <strong>of</strong> the neighbouring mountainridges and landscape <strong>of</strong> the riparian corridor. A variation <strong>of</strong> this method will also include differentenvironmental management plans as characteristics (restrictions on coal mining, restrictions onagriculture, etc.). Then in addition to having indices to guide policy making, one can have ordinalpreference rankings <strong>of</strong> bundles <strong>of</strong> environmental characteristics and management policies.An abbreviated and illustrative presentation <strong>of</strong> such a choice set is presented below. It shouldbe noted that the characteristics are chosen solely for the purposes <strong>of</strong> this example and have not yetbeen translated into “user-friendly” wording and units <strong>of</strong> measurement, which would be utilised in theactual surveys.Question: Which option for the future <strong>of</strong> the environment in the Clinch Valley do youprefer the most, Option A, Option B, or Option C? Option C is the status quo, or what is currentlyhappening and will continue to happen with no further environmental policy.24The Clinch/Powell River system contains seven fish species and 28 mussel species which are federallylisted as threatened or endangered.106
- Page 1 and 2:
«ENVIRONMENTValuation ofBiodiversi
- Page 3 and 4:
ORGANISATION FOR ECONOMIC CO-OPERAT
- Page 5 and 6:
TABLE OF CONTENTSPART 1 ...........
- Page 7 and 8:
PART 4 ............................
- Page 10 and 11:
Why value biodiversity?There are th
- Page 12 and 13:
Figure 1.1 Total economic value: us
- Page 14 and 15:
from biodiversity at the local leve
- Page 16 and 17:
in the database and also for undert
- Page 18 and 19:
in the policy context. This is high
- Page 20:
Table 1.3 Policy Options for the Cl
- Page 23 and 24:
Box 1.2 Value of Turkey’s Forests
- Page 25 and 26:
of the most important implications
- Page 27 and 28:
Additionally, valuation does not ju
- Page 29 and 30:
value is the habitat, many differen
- Page 31 and 32:
are very modest. More recently, new
- Page 33 and 34:
Table 2.2 Estimates of the Medicina
- Page 35 and 36:
The importance of indirect use valu
- Page 37 and 38:
pharmaceutical use, although the li
- Page 39 and 40:
McAllister, D., (1991). Estimating
- Page 41 and 42:
Simpson, D and Craft, A.. (1996).
- Page 43 and 44:
practice, the overlap between these
- Page 45 and 46:
aimed at giving more precise quanti
- Page 47 and 48: structural values. There are a numb
- Page 49 and 50: Reid (forthcoming) discusses the po
- Page 51 and 52: Ecotourism as a Way to Generate Loc
- Page 53 and 54: endangered Indian rhino and other t
- Page 55 and 56: ReferencesBann, C., and M. Clemens
- Page 57 and 58: PART 261
- Page 59 and 60: many European countries, CBA has a
- Page 61 and 62: (1) Cost and time constraintsThe co
- Page 63 and 64: activity day, there is greater vari
- Page 65 and 66: added independent variable C s= cha
- Page 67 and 68: error in valuing respiratory sympto
- Page 69 and 70: ReferencesArrow, K.J., R. Solow, E.
- Page 71 and 72: OECD (1995). The Economic Appraisal
- Page 73 and 74: CHAPTER 5:by José Manuel LIMA E SA
- Page 75 and 76: linkages usually lead to diverse co
- Page 77 and 78: A discrete choice approach to quest
- Page 79 and 80: Table 5.2 Model-based point estimat
- Page 81 and 82: is potentially very large for multi
- Page 83 and 84: P3 is already in the mix is 2.51, s
- Page 85 and 86: PART 391
- Page 87 and 88: measures of value. An appendix to t
- Page 89 and 90: features (such as parks, beaches or
- Page 91 and 92: included in cost-benefit analysis o
- Page 93 and 94: A Discussion of Past Efforts to Dev
- Page 95 and 96: Satellite AccountsIn addition to th
- Page 97: which many people argue are associa
- Page 101 and 102: Figure 6.2 Trade-Off AnalysisEnviro
- Page 103 and 104: However, the farmers need not bear
- Page 105 and 106: Appendix 1: Theory and Application
- Page 107 and 108: iwhere C is the income adjustment n
- Page 109 and 110: complete. If there are more than on
- Page 111 and 112: Horowitz, Joel. L. and Jordan. J. L
- Page 113 and 114: CHAPTER 7:by Dennis M. KING and Lis
- Page 115 and 116: Box 7.1 Definition of terms related
- Page 117 and 118: Box 7.2 Categories of Ecosystem Ser
- Page 119 and 120: Box 7.4 Dollar-based ecosystem valu
- Page 121 and 122: Non-monetary indicators of ecosyste
- Page 123 and 124: Figure 7.1 Effects of Wetland Locat
- Page 125 and 126: description, and that the usefulnes
- Page 127 and 128: 2) Service capacity sub-indexIndica
- Page 129 and 130: wetlands, for example, results in F
- Page 131 and 132: (1) Functional CapacityIndexFigure
- Page 133 and 134: constituents of runoff can be predi
- Page 135 and 136: Service(on or off site)Recreational
- Page 137 and 138: Table 7.3 Service Risk Sub-index De
- Page 139 and 140: Measuring Service Preference Weight
- Page 141 and 142: Table 7.4 Illustration of Paired Co
- Page 143 and 144: PART 4151
- Page 145 and 146: Ecological foundations for biodiver
- Page 147 and 148: Phenotic diversity is a measure bas
- Page 149 and 150:
Operationalisation of the biotic-ri
- Page 151 and 152:
ten attributes that could score a m
- Page 153 and 154:
The choice of the scale relates to
- Page 155 and 156:
Nature measurement methodIn 1995, t
- Page 157 and 158:
Table 8.4 Value orientations and en
- Page 159 and 160:
Table 8.5 Identification of monetar
- Page 161 and 162:
Table 8.6 Valuation studiesSingle s
- Page 163 and 164:
in waterway systems for nine impact
- Page 165 and 166:
to other contexts, conditions, loca
- Page 167 and 168:
ReferencesAkcakaya, H.R. (1994).
- Page 169 and 170:
de Groot, R.S. (1994). “Environme
- Page 171 and 172:
Mace, G. M. & S. N. Stuart. (1994).
- Page 173 and 174:
Turner, R.K., Perrings, C. and Folk
- Page 175 and 176:
John A. DixonJohn A. Dixon is Lead
- Page 177 and 178:
Robert O’NeillDr. O’Neill recei
- Page 179 and 180:
Steven StewartSteven Stewart is Ass
- Page 181:
OECD PUBLICATIONS, 2, rue André-Pa