Valuation of Biodiversity Benefits (OECD)
Valuation of Biodiversity Benefits (OECD)
Valuation of Biodiversity Benefits (OECD)
- No tags were found...

You also want an ePaper? Increase the reach of your titles
YUMPU automatically turns print PDFs into web optimized ePapers that Google loves.
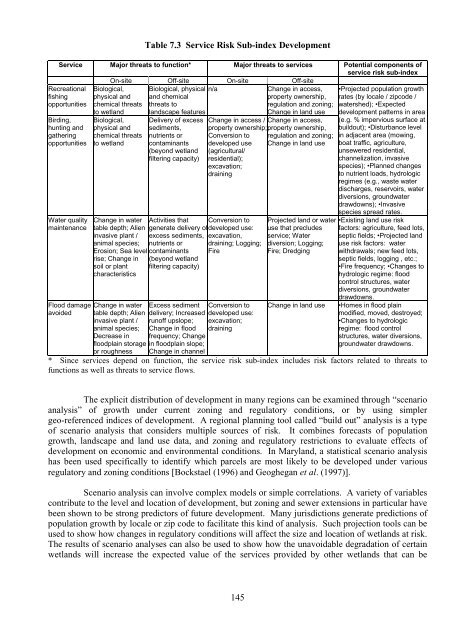
Table 7.3 Service Risk Sub-index DevelopmentService Major threats to function* Major threats to services Potential components <strong>of</strong>service risk sub-indexOn-site Off-site On-site Off-siteRecreationalfishingopportunitiesBirding,hunting andgatheringopportunitiesWater qualitymaintenanceFlood damageavoidedBiological,physical andchemical threatsto wetlandBiological,physical andchemical threatsto wetlandChange in watertable depth; Alieninvasive plant /animal species;Erosion; Sea levelrise; Change insoil or plantcharacteristicsChange in watertable depth; Alieninvasive plant /animal species;Decrease infloodplain storageor roughnessBiological, physicaland chemicalthreats tolandscape featuresDelivery <strong>of</strong> excesssediments,nutrients orcontaminants(beyond wetlandfiltering capacity)Activities thatgenerate delivery <strong>of</strong>excess sediments,nutrients orcontaminants(beyond wetlandfiltering capacity)Excess sedimentdelivery; Increasedrun<strong>of</strong>f upslope;Change in floodfrequency; Changein floodplain slope;Change in channeln/aChange in access,property ownership,regulation and zoning;Change in land useChange in access / Change in access,property ownership; property ownership,Conversion to regulation and zoning;developed use Change in land use(agricultural/residential);excavation;drainingConversion todeveloped use:excavation,draining; Logging;FireConversion todeveloped use:excavation;drainingProjected land or wateruse that precludesservice; Waterdiversion; Logging;Fire; DredgingChange in land use•Projected population growthrates (by locale / zipcode /watershed); •Expecteddevelopment patterns in area(e.g. % impervious surface atbuildout); •Disturbance levelin adjacent area (mowing,boat traffic, agriculture,unsewered residential,channelization, invasivespecies); •Planned changesto nutrient loads, hydrologicregimes (e.g., waste waterdischarges, reservoirs, waterdiversions, groundwaterdrawdowns); •Invasivespecies spread rates.•Existing land use riskfactors: agriculture, feed lots,septic fields; •Projected landuse risk factors: waterwithdrawals; new feed lots,septic fields, logging , etc.;•Fire frequency; •Changes tohydrologic regime: floodcontrol structures, waterdiversions, groundwaterdrawdowns.•Homes in flood plainmodified, moved, destroyed;•Changes to hydrologicregime: flood controlstructures, water diversions,groundwater drawdowns.* Since services depend on function, the service risk sub-index includes risk factors related to threats t<strong>of</strong>unctions as well as threats to service flows.The explicit distribution <strong>of</strong> development in many regions can be examined through “scenarioanalysis” <strong>of</strong> growth under current zoning and regulatory conditions, or by using simplergeo-referenced indices <strong>of</strong> development. A regional planning tool called “build out” analysis is a type<strong>of</strong> scenario analysis that considers multiple sources <strong>of</strong> risk. It combines forecasts <strong>of</strong> populationgrowth, landscape and land use data, and zoning and regulatory restrictions to evaluate effects <strong>of</strong>development on economic and environmental conditions. In Maryland, a statistical scenario analysishas been used specifically to identify which parcels are most likely to be developed under variousregulatory and zoning conditions [Bockstael (1996) and Geoghegan et al. (1997)].Scenario analysis can involve complex models or simple correlations. A variety <strong>of</strong> variablescontribute to the level and location <strong>of</strong> development, but zoning and sewer extensions in particular havebeen shown to be strong predictors <strong>of</strong> future development. Many jurisdictions generate predictions <strong>of</strong>population growth by locale or zip code to facilitate this kind <strong>of</strong> analysis. Such projection tools can beused to show how changes in regulatory conditions will affect the size and location <strong>of</strong> wetlands at risk.The results <strong>of</strong> scenario analyses can also be used to show how the unavoidable degradation <strong>of</strong> certainwetlands will increase the expected value <strong>of</strong> the services provided by other wetlands that can be145