Valuation of Biodiversity Benefits (OECD)
Valuation of Biodiversity Benefits (OECD)
Valuation of Biodiversity Benefits (OECD)
- No tags were found...

Create successful ePaper yourself
Turn your PDF publications into a flip-book with our unique Google optimized e-Paper software.
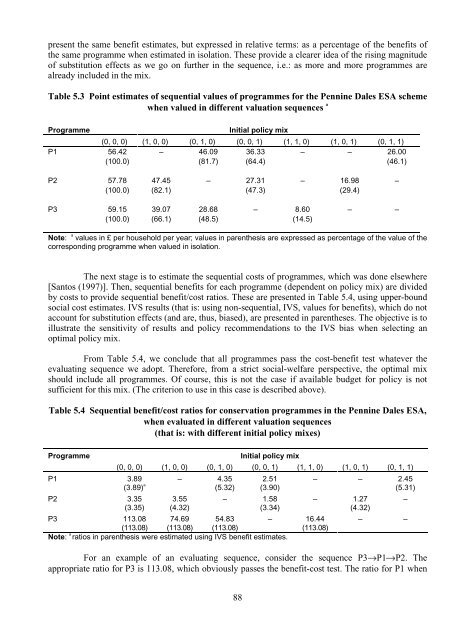
present the same benefit estimates, but expressed in relative terms: as a percentage <strong>of</strong> the benefits <strong>of</strong>the same programme when estimated in isolation. These provide a clearer idea <strong>of</strong> the rising magnitude<strong>of</strong> substitution effects as we go on further in the sequence, i.e.: as more and more programmes arealready included in the mix.Table 5.3 Point estimates <strong>of</strong> sequential values <strong>of</strong> programmes for the Pennine Dales ESA schemewhen valued in different valuation sequences aProgrammeInitial policy mix(0, 0, 0) (1, 0, 0) (0, 1, 0) (0, 0, 1) (1, 1, 0) (1, 0, 1) (0, 1, 1)P1 56.42(100.0)– 46.09(81.7)36.33(64.4)– – 26.00(46.1)P2 57.78(100.0)47.45(82.1)– 27.31(47.3)– 16.98(29.4)–P3 59.15(100.0)39.07(66.1)28.68(48.5)– 8.60(14.5)– –Note: a values in £ per household per year; values in parenthesis are expressed as percentage <strong>of</strong> the value <strong>of</strong> thecorresponding programme when valued in isolation.The next stage is to estimate the sequential costs <strong>of</strong> programmes, which was done elsewhere[Santos (1997)]. Then, sequential benefits for each programme (dependent on policy mix) are dividedby costs to provide sequential benefit/cost ratios. These are presented in Table 5.4, using upper-boundsocial cost estimates. IVS results (that is: using non-sequential, IVS, values for benefits), which do notaccount for substitution effects (and are, thus, biased), are presented in parentheses. The objective is toillustrate the sensitivity <strong>of</strong> results and policy recommendations to the IVS bias when selecting anoptimal policy mix.From Table 5.4, we conclude that all programmes pass the cost-benefit test whatever theevaluating sequence we adopt. Therefore, from a strict social-welfare perspective, the optimal mixshould include all programmes. Of course, this is not the case if available budget for policy is notsufficient for this mix. (The criterion to use in this case is described above).Table 5.4 Sequential benefit/cost ratios for conservation programmes in the Pennine Dales ESA,when evaluated in different valuation sequences(that is: with different initial policy mixes)ProgrammeInitial policy mix(0, 0, 0) (1, 0, 0) (0, 1, 0) (0, 0, 1) (1, 1, 0) (1, 0, 1) (0, 1, 1)P1 3.89(3.89) a – 4.35(5.32)P2 3.35(3.35)P3 113.08(113.08)3.55(4.32)2.51(3.90)– 1.58(3.34)74.69(113.08)54.83(113.08)– 16.44(113.08)Note: a ratios in parenthesis were estimated using IVS benefit estimates.– – 2.45(5.31)– 1.27(4.32)–– –For an example <strong>of</strong> an evaluating sequence, consider the sequence P3®P1®P2. Theappropriate ratio for P3 is 113.08, which obviously passes the benefit-cost test. The ratio for P1 when88