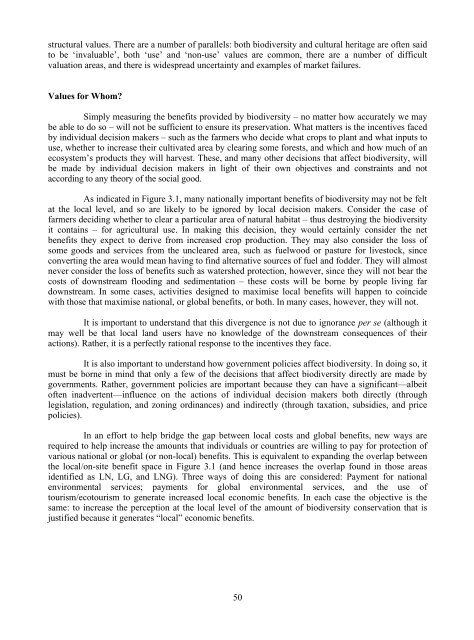
‘quasi-option value’, which arises from the desire to preserve a resource in the expectation that asinformation and knowledge develop, we can learn more about the values <strong>of</strong> the resource and whetheror not we want to preserve it. How much should we be willing to pay for this, however? The record <strong>of</strong>actual payments from potential users <strong>of</strong> this information, such as pharmaceutical companies, is hardlyencouraging. Even in Costa Rica, which is a megabiodiversity country with well established protectedareas and an internationally known biological research center, National Institute <strong>of</strong> Biology (INBio),actual payments for the option <strong>of</strong> the use <strong>of</strong> this biological information is only several million dollarsin total – hardly the sorts <strong>of</strong> sums that are likely to meet the opportunity costs <strong>of</strong> protecting significantareas <strong>of</strong> tropical ecosystems! 5The last major categories <strong>of</strong> non-use value are existence value and bequest values. Existencevalues arise from the pleasure people derive from the existence <strong>of</strong> biodiversity, even if they do notplan to use it. This value can be important, especially for charismatic species such as elephants,pandas, whales, or tigers, and for special, unique ecosystems such as certain pristine mountain, arctic,forest, or coastal areas. Bequest values are those values that come from leaving something for ourchildren and future generations. Because existence value reflects preferences, which are not reflectedin any market behaviour, survey-based methods such as CV are the sole means <strong>of</strong> measuring it. 6As a result <strong>of</strong> these problems, there are obviously differing levels <strong>of</strong> confidence in economicestimates for different resources and for different countries. Table 3.1 lists selected important uses andvalues associated with biodiversity and the level <strong>of</strong> confidence in the economic value estimates foreach. In general the level <strong>of</strong> confidence is highest for direct-use, consumptive uses (<strong>of</strong>ten <strong>of</strong> biologicalresources rather than biodiversity per se). Here one usually has a definite P (price) and Q (quantity).The lowest level <strong>of</strong> confidence is for existence or option values for genetic material, not surprisingsince the level <strong>of</strong> certainty here is also the lowest.Table 3.1 Levels <strong>of</strong> Confidence in Estimates <strong>of</strong> the Economic Value <strong>of</strong> <strong>Biodiversity</strong>ValueDirect use valuesTourism/ recreationEcosystem servicesExistence/ option values (individual)Existence/ option values (genetic)ConfidenceHighMediumLow-MediumMediumVery low-MediumIt is interesting that there are many similarities between biodiversity valuation and anothernew valuation area – the valuation <strong>of</strong> cultural heritage [Pagiola (1996)]. In both cases, much <strong>of</strong> themeasurable value resides in various direct or indirect uses by individuals and societies, not in intrinsic56There are some interesting, and instructive, parallels between prospecting for oil and ‘prospecting’ forbiodiversity. In the case <strong>of</strong> oil, companies pay very large sums for prospecting rights. These costs<strong>of</strong>ten total 80% <strong>of</strong> total production costs. In contrast, actual payments for biodiversity ‘prospecting’have been very small. Part <strong>of</strong> this difference arises from the high degree <strong>of</strong> certainty on the marketvalue <strong>of</strong> oil, once found. In the case <strong>of</strong> biodiversity, in contrast, there is uncertainty over bothdiscovering new genetic material, and over its value if found. In addition, the time horizon from newdiscovery to commercial sales may be very long. All <strong>of</strong> these factors result in a much lowerwillingness-to-pay for biodiversity prospecting rights as compared to oil and gas prospecting rights.A vast literature has developed on contingent valuation techniques. Although the technique has longbeen controversial, a ‘blue-ribbon’ panel composed <strong>of</strong> several Nobel prize winners found that,properly used, it can lead to reliable estimates <strong>of</strong> existence value (which the panel called ‘passive use’value). The report <strong>of</strong> this panel [NOAA (1993)] is generally regarded as authoritative on appropriateuse <strong>of</strong> the technique. For an overview <strong>of</strong> recent work in this field, see Carson (1997).49
structural values. There are a number <strong>of</strong> parallels: both biodiversity and cultural heritage are <strong>of</strong>ten saidto be ‘invaluable’, both ‘use’ and ‘non-use’ values are common, there are a number <strong>of</strong> difficultvaluation areas, and there is widespread uncertainty and examples <strong>of</strong> market failures.Values for Whom?Simply measuring the benefits provided by biodiversity – no matter how accurately we maybe able to do so – will not be sufficient to ensure its preservation. What matters is the incentives facedby individual decision makers – such as the farmers who decide what crops to plant and what inputs touse, whether to increase their cultivated area by clearing some forests, and which and how much <strong>of</strong> anecosystem’s products they will harvest. These, and many other decisions that affect biodiversity, willbe made by individual decision makers in light <strong>of</strong> their own objectives and constraints and notaccording to any theory <strong>of</strong> the social good.As indicated in Figure 3.1, many nationally important benefits <strong>of</strong> biodiversity may not be feltat the local level, and so are likely to be ignored by local decision makers. Consider the case <strong>of</strong>farmers deciding whether to clear a particular area <strong>of</strong> natural habitat – thus destroying the biodiversityit contains – for agricultural use. In making this decision, they would certainly consider the netbenefits they expect to derive from increased crop production. They may also consider the loss <strong>of</strong>some goods and services from the uncleared area, such as fuelwood or pasture for livestock, sinceconverting the area would mean having to find alternative sources <strong>of</strong> fuel and fodder. They will almostnever consider the loss <strong>of</strong> benefits such as watershed protection, however, since they will not bear thecosts <strong>of</strong> downstream flooding and sedimentation – these costs will be borne by people living fardownstream. In some cases, activities designed to maximise local benefits will happen to coincidewith those that maximise national, or global benefits, or both. In many cases, however, they will not.It is important to understand that this divergence is not due to ignorance per se (although itmay well be that local land users have no knowledge <strong>of</strong> the downstream consequences <strong>of</strong> theiractions). Rather, it is a perfectly rational response to the incentives they face.It is also important to understand how government policies affect biodiversity. In doing so, itmust be borne in mind that only a few <strong>of</strong> the decisions that affect biodiversity directly are made bygovernments. Rather, government policies are important because they can have a significant—albeit<strong>of</strong>ten inadvertent—influence on the actions <strong>of</strong> individual decision makers both directly (throughlegislation, regulation, and zoning ordinances) and indirectly (through taxation, subsidies, and pricepolicies).In an effort to help bridge the gap between local costs and global benefits, new ways arerequired to help increase the amounts that individuals or countries are willing to pay for protection <strong>of</strong>various national or global (or non-local) benefits. This is equivalent to expanding the overlap betweenthe local/on-site benefit space in Figure 3.1 (and hence increases the overlap found in those areasidentified as LN, LG, and LNG). Three ways <strong>of</strong> doing this are considered: Payment for nationalenvironmental services; payments for global environmental services, and the use <strong>of</strong>tourism/ecotourism to generate increased local economic benefits. In each case the objective is thesame: to increase the perception at the local level <strong>of</strong> the amount <strong>of</strong> biodiversity conservation that isjustified because it generates “local” economic benefits.50
- Page 1 and 2: «ENVIRONMENTValuation ofBiodiversi
- Page 3 and 4: ORGANISATION FOR ECONOMIC CO-OPERAT
- Page 5 and 6: TABLE OF CONTENTSPART 1 ...........
- Page 7 and 8: PART 4 ............................
- Page 10 and 11: Why value biodiversity?There are th
- Page 12 and 13: Figure 1.1 Total economic value: us
- Page 14 and 15: from biodiversity at the local leve
- Page 16 and 17: in the database and also for undert
- Page 18 and 19: in the policy context. This is high
- Page 20: Table 1.3 Policy Options for the Cl
- Page 23 and 24: Box 1.2 Value of Turkey’s Forests
- Page 25 and 26: of the most important implications
- Page 27 and 28: Additionally, valuation does not ju
- Page 29 and 30: value is the habitat, many differen
- Page 31 and 32: are very modest. More recently, new
- Page 33 and 34: Table 2.2 Estimates of the Medicina
- Page 35 and 36: The importance of indirect use valu
- Page 37 and 38: pharmaceutical use, although the li
- Page 39 and 40: McAllister, D., (1991). Estimating
- Page 41 and 42: Simpson, D and Craft, A.. (1996).
- Page 43 and 44: practice, the overlap between these
- Page 45: aimed at giving more precise quanti
- Page 49 and 50: Reid (forthcoming) discusses the po
- Page 51 and 52: Ecotourism as a Way to Generate Loc
- Page 53 and 54: endangered Indian rhino and other t
- Page 55 and 56: ReferencesBann, C., and M. Clemens
- Page 57 and 58: PART 261
- Page 59 and 60: many European countries, CBA has a
- Page 61 and 62: (1) Cost and time constraintsThe co
- Page 63 and 64: activity day, there is greater vari
- Page 65 and 66: added independent variable C s= cha
- Page 67 and 68: error in valuing respiratory sympto
- Page 69 and 70: ReferencesArrow, K.J., R. Solow, E.
- Page 71 and 72: OECD (1995). The Economic Appraisal
- Page 73 and 74: CHAPTER 5:by José Manuel LIMA E SA
- Page 75 and 76: linkages usually lead to diverse co
- Page 77 and 78: A discrete choice approach to quest
- Page 79 and 80: Table 5.2 Model-based point estimat
- Page 81 and 82: is potentially very large for multi
- Page 83 and 84: P3 is already in the mix is 2.51, s
- Page 85 and 86: PART 391
- Page 87 and 88: measures of value. An appendix to t
- Page 89 and 90: features (such as parks, beaches or
- Page 91 and 92: included in cost-benefit analysis o
- Page 93 and 94: A Discussion of Past Efforts to Dev
- Page 95 and 96: Satellite AccountsIn addition to th
- Page 97 and 98:
which many people argue are associa
- Page 99 and 100:
approach to competing uses of water
- Page 101 and 102:
Figure 6.2 Trade-Off AnalysisEnviro
- Page 103 and 104:
However, the farmers need not bear
- Page 105 and 106:
Appendix 1: Theory and Application
- Page 107 and 108:
iwhere C is the income adjustment n
- Page 109 and 110:
complete. If there are more than on
- Page 111 and 112:
Horowitz, Joel. L. and Jordan. J. L
- Page 113 and 114:
CHAPTER 7:by Dennis M. KING and Lis
- Page 115 and 116:
Box 7.1 Definition of terms related
- Page 117 and 118:
Box 7.2 Categories of Ecosystem Ser
- Page 119 and 120:
Box 7.4 Dollar-based ecosystem valu
- Page 121 and 122:
Non-monetary indicators of ecosyste
- Page 123 and 124:
Figure 7.1 Effects of Wetland Locat
- Page 125 and 126:
description, and that the usefulnes
- Page 127 and 128:
2) Service capacity sub-indexIndica
- Page 129 and 130:
wetlands, for example, results in F
- Page 131 and 132:
(1) Functional CapacityIndexFigure
- Page 133 and 134:
constituents of runoff can be predi
- Page 135 and 136:
Service(on or off site)Recreational
- Page 137 and 138:
Table 7.3 Service Risk Sub-index De
- Page 139 and 140:
Measuring Service Preference Weight
- Page 141 and 142:
Table 7.4 Illustration of Paired Co
- Page 143 and 144:
PART 4151
- Page 145 and 146:
Ecological foundations for biodiver
- Page 147 and 148:
Phenotic diversity is a measure bas
- Page 149 and 150:
Operationalisation of the biotic-ri
- Page 151 and 152:
ten attributes that could score a m
- Page 153 and 154:
The choice of the scale relates to
- Page 155 and 156:
Nature measurement methodIn 1995, t
- Page 157 and 158:
Table 8.4 Value orientations and en
- Page 159 and 160:
Table 8.5 Identification of monetar
- Page 161 and 162:
Table 8.6 Valuation studiesSingle s
- Page 163 and 164:
in waterway systems for nine impact
- Page 165 and 166:
to other contexts, conditions, loca
- Page 167 and 168:
ReferencesAkcakaya, H.R. (1994).
- Page 169 and 170:
de Groot, R.S. (1994). “Environme
- Page 171 and 172:
Mace, G. M. & S. N. Stuart. (1994).
- Page 173 and 174:
Turner, R.K., Perrings, C. and Folk
- Page 175 and 176:
John A. DixonJohn A. Dixon is Lead
- Page 177 and 178:
Robert O’NeillDr. O’Neill recei
- Page 179 and 180:
Steven StewartSteven Stewart is Ass
- Page 181:
OECD PUBLICATIONS, 2, rue André-Pa