

2.8 MEUR - Gorenje - Gorenje Group
2.8 MEUR - Gorenje - Gorenje Group
2.8 MEUR - Gorenje - Gorenje Group

Create successful ePaper yourself
Turn your PDF publications into a flip-book with our unique Google optimized e-Paper software.
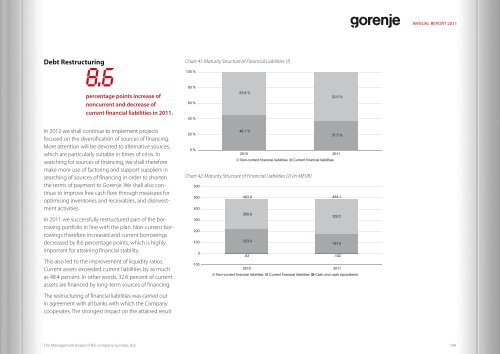
Debt Restructuring<br />
8.6<br />
percentage points increase of<br />
noncurrent and decrease of<br />
current financial liabilities in 2011.<br />
In 2012 we shall continue to implement projects<br />
focused on the diversification of sources of financing.<br />
More attention will be devoted to alternative sources,<br />
which are particularly suitable in times of crisis. In<br />
searching for sources of financing, we shall therefore<br />
make more use of factoring and support suppliers in<br />
searching of sources of financing in order to shorten<br />
the terms of payment to <strong>Gorenje</strong>. We shall also continue<br />
to improve free cash flow through measures for<br />
optimising inventories and receivables, and disinvestment<br />
activities.<br />
In 2011 we successfully restructured part of the borrowing<br />
portfolio in line with the plan. Non-current borrowings<br />
therefore increased and current borrowings<br />
decreased by 8.6 percentage points, which is highly<br />
important for attaining financial stability.<br />
This also led to the improvement of liquidity ratios.<br />
Current assets exceeded current liabilities by as much<br />
as 48.4 percent. In other words, 32.6 percent of current<br />
assets are financed by long-term sources of financing.<br />
The restructuring of financial liabilities was carried out<br />
in agreement with all banks with which the Company<br />
cooperates. The strongest impact on the attained result<br />
The Management Board of the company <strong>Gorenje</strong>, d.d.<br />
Chart 41: Maturity Structure of Financial Liabilities (1)<br />
100 %<br />
80 %<br />
60 %<br />
40 %<br />
20 %<br />
0 %<br />
53.9 %<br />
46.1 %<br />
62.5 %<br />
2010 2011<br />
Non-current financial liabilities Current financial liabilities<br />
Chart 42: Maturity Structure of Financial Liabilities (2) (in <strong>MEUR</strong>)<br />
600<br />
500<br />
400<br />
300<br />
200<br />
100<br />
0<br />
-100<br />
37.5 %<br />
483.9 484.1<br />
260.9<br />
223.0<br />
302.5<br />
181.6<br />
-83 -102<br />
2010 2011<br />
Non-current financial liabilities Current financial liabilities Cash and cash equivalents<br />
ANNUAL REPORT 2011<br />
104