

2.8 MEUR - Gorenje - Gorenje Group
2.8 MEUR - Gorenje - Gorenje Group
2.8 MEUR - Gorenje - Gorenje Group

You also want an ePaper? Increase the reach of your titles
YUMPU automatically turns print PDFs into web optimized ePapers that Google loves.
I.<br />
We are the <strong>Gorenje</strong> <strong>Group</strong><br />
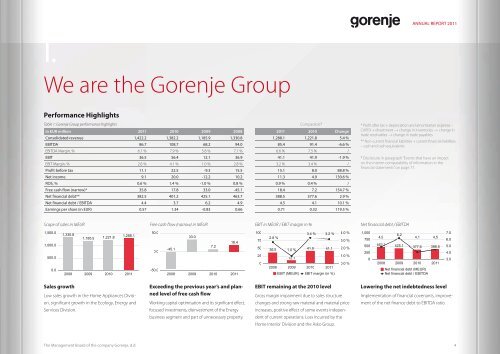
Performance Highlights<br />
Table 1: <strong>Gorenje</strong> <strong>Group</strong> performance highlights Comparable 1<br />
in EUR million 2011 2010 2009 2008 2011 2010 Change<br />
Consolidated revenue 1,422.2 1,382.2 1,185.9 1,330.8 1,288.1 1,221.8 5.4 %<br />
EBITDA 86.7 108.7 68.2 94.0 85.4 91.4 -6.6 %<br />
EBITDA Margin, % 6.1 % 7.9 % 5.8 % 7.1 % 6.6 % 7.5 % /<br />
EBIT 36.5 56.4 12.1 36.9 41.1 41.9 -1.9 %<br />
EBIT Margin, % 2.6 % 4.1 % 1.0 % <strong>2.8</strong> % 3.2 % 3.4 % /<br />
Profit before tax 11.1 22.5 -9.3 15.5 15.1 8.0 88.8 %<br />
Net income 9.1 20.0 -12.2 10.2 11.3 4.9 130.6 %<br />
ROS, % 0.6 % 1.4 % -1.0 % 0.8 % 0.9 % 0.4 % /<br />
Free cash flow (narrow)* 35.8 17.8 33.0 -45.1 18.4 7.2 154.7 %<br />
Net financial debt** 382.5 401.2 425.1 463.7 388.5 377.6 2.9 %<br />
Net financial debt / EBITDA 4.4 3.7 6.2 4.9 4.5 4.1 10.1 %<br />
Earnings per share (in EUR) 0.57 1.34 -0.83 0.66 0.71 0.32 119.5 %<br />
1,500.0<br />
1,000.0<br />
500.0<br />
0.0<br />
1,330.8<br />
Sales growth<br />
1,185.9<br />
1,221.8<br />
1,288.1<br />
2008 2009 2010 2011<br />
Low sales growth in the Home Appliances Division,<br />
significant growth in the Ecology, Energy and<br />
Services Division.<br />
The Management Board of the company <strong>Gorenje</strong>, d.d.<br />
50.0<br />
0.0<br />
-50.0<br />
-45.1<br />
33.0<br />
7.2<br />
18.4<br />
2008 2009 2010 2011<br />
Exceeding the previous year’s and planned<br />
level of free cash flow<br />
Working capital optimisation and its significant effect,<br />
focused investments, disinvestment of the Energy<br />
business segment and part of unnecessary property.<br />
100<br />
75<br />
50<br />
25<br />
0<br />
<strong>2.8</strong> %<br />
36.9<br />
1.0 %<br />
12.1<br />
3.4 % 3.2 %<br />
41.9 41.1<br />
2008 2009 2010 2011<br />
EBIT (<strong>MEUR</strong>) EBIT margin (in %)<br />
4.0 %<br />
3.0 %<br />
2.0 %<br />
1.0 %<br />
0.0 %<br />
EBIT remaining at the 2010 level<br />
Gross margin impairment due to sales structure<br />
changes and strong raw material and material price<br />
increases, positive effect of some events independent<br />
of current operations. Loss incurred by the<br />
Home Interior Division and the Asko <strong>Group</strong>.<br />
ANNUAL REPORT 2011<br />
* Profit after tax + depreciation and amortisation expense –<br />
CAPEX + divestment –+ change in inventories –+ change in<br />
trade receivables –+ change in trade payables<br />
** Non-current financial liabilities + current financial liabilities<br />
– cash and cash equivalents<br />
1 Disclosure in paragraph “Events that have an impact<br />
on the interim comparability of information in the<br />
financial statements” on page 77.<br />
Scope of sales in <strong>MEUR</strong> Free cash flow (narrow) in <strong>MEUR</strong> EBIT in <strong>MEUR</strong> / EBIT margin in % Net financial debt / EBITDA<br />
1,000<br />
750<br />
500<br />
250<br />
0<br />
4,9<br />
6,2<br />
4,1 4,5<br />
463.7 425.1 377.6 388.5<br />
2008 2009 2010 2011<br />
Net financial debt (<strong>MEUR</strong>)<br />
Net financial debt / EBITDA<br />
7.0<br />
6.0<br />
5.0<br />
4.0<br />
3.0<br />
Lowering the net indebtedness level<br />
Implementation of financial covenants, improvement<br />
of the net finance debt to EBITDA ratio.<br />
4