- Page 1 and 2:
Annual report 2013 Annual report 20
- Page 3 and 4:
Cash Flow Management ..............
- Page 5 and 6:
Letter from the President of the Ma
- Page 7 and 8:
Presentation of the Gorenje Group C
- Page 9 and 10:
Production and Products In 2011 pro
- Page 11 and 12:
Table 3: Awards received by Gorenje
- Page 13 and 14:
Movements in Share Prices 62.9 % Ta
- Page 15 and 16:
Investor Relations 53 meetings with
- Page 17 and 18:
Financial Calendar for the Year 201
- Page 19 and 20:
II. New Strategy 2012 - 2015 The Ma
- Page 21 and 22:
Picture 2: Vision, mission, values
- Page 23 and 24:
Volatile Raw Materials Market We ex
- Page 25 and 26:
Measures for Performance Improvemen
- Page 27 and 28:
Niche Orientation of Operation In n
- Page 29 and 30:
of operating liabilities. This is k
- Page 31 and 32:
Operative time frame of the strateg
- Page 33 and 34: Net profitability The anticipated l
- Page 35 and 36: III. Corporate Governance Statement
- Page 37 and 38: Members of the Management Board Fra
- Page 39 and 40: Supervisory Board A high degree of
- Page 41 and 42: Dr. Peter Kraljič, Member of the S
- Page 43 and 44: Supervisory Board Committees Audit
- Page 45 and 46: of toolmaking and industrial equipm
- Page 47 and 48: the development of operations and t
- Page 49 and 50: Trading in Shares of Management and
- Page 51 and 52: Corporate Governance Code Complianc
- Page 53 and 54: General Meeting of Shareholders In
- Page 55 and 56: IV. Social Responsibility In Gorenj
- Page 57 and 58: of reduced demand for our products.
- Page 59 and 60: The absenteeism control team plays
- Page 61 and 62: Education In past years our educati
- Page 63 and 64: Social Environment Acting responsib
- Page 65 and 66: Ecology EMAS Statement The EU Eco-M
- Page 67 and 68: from the first phase of this projec
- Page 69 and 70: 7. Environmental Management Efficie
- Page 71 and 72: Šoštanj Site The quantity of gene
- Page 73 and 74: Listed below are the media that fea
- Page 75 and 76: Environmental Auditor’s Statement
- Page 77 and 78: Events Impacting Interim Comparabil
- Page 79 and 80: Gorenje Group Performance 35.8 MEUR
- Page 81 and 82: Chart 16: Revenue per divisions (in
- Page 83: low share in the Gorenje Group’s
- Page 87 and 88: Chart 23: Revenue by programmes of
- Page 89 and 90: Under consideration of the period J
- Page 91 and 92: Chart 27: Quarterly movement of pro
- Page 93 and 94: Chart 29: Revenue by HI Division pr
- Page 95 and 96: Added value per employee in the amo
- Page 97 and 98: Volume of Business Activities 21.7
- Page 99 and 100: esult of a very low potential of in
- Page 101 and 102: Financial Position and Liquidity 18
- Page 103 and 104: Investments In the area of investme
- Page 105 and 106: was due to long-term borrowings in
- Page 107 and 108: Risks Risk management in the Gorenj
- Page 109 and 110: investment and development risks. T
- Page 111 and 112: inability of the Group to settle it
- Page 113 and 114: Risk management in the Home Interio
- Page 115 and 116: VI. Accounting Report of the Gorenj
- Page 117 and 118: Statement of Comprehensive Income o
- Page 119 and 120: Consolidated Statement of Cash Flow
- Page 121 and 122: in TEUR Share capital Share premium
- Page 123 and 124: Note 3 - Significant accounting pol
- Page 125 and 126: ANNUAL REPORT 2011 (c) Financial in
- Page 127 and 128: ANNUAL REPORT 2011 The gain or loss
- Page 129 and 130: ANNUAL REPORT 2011 that a loss even
- Page 131 and 132: ANNUAL REPORT 2011 (iv) Provisions
- Page 133 and 134: ANNUAL REPORT 2011 (u) New standard
- Page 135 and 136:
ANNUAL REPORT 2011 � additional c
- Page 137 and 138:
Note 8 - Composition of the Gorenje
- Page 139 and 140:
Associates: � in Kishinev (Moldov
- Page 141 and 142:
Note 11 - Associates ANNUAL REPORT
- Page 143 and 144:
ANNUAL REPORT 2011 Note 17 - Other
- Page 145 and 146:
The following deferred tax amounts
- Page 147 and 148:
Movements of intangible assets in 2
- Page 149 and 150:
Movements of property, plant and eq
- Page 151 and 152:
Movements of investment property AN
- Page 153 and 154:
ANNUAL REPORT 2011 Note 26 - Invent
- Page 155 and 156:
in TEUR Changes in fair value reser
- Page 157 and 158:
in TEUR Movements of provisions in
- Page 159 and 160:
Currency ANNUAL REPORT 2011 Current
- Page 161 and 162:
Maturity of trade receivables at th
- Page 163 and 164:
The following significant exchange
- Page 165 and 166:
Fair value scale The table shows me
- Page 167 and 168:
Note 46 - Business segments in TEUR
- Page 169 and 170:
Appendix 1: Information on the Gore
- Page 171 and 172:
Appendix 2: Managing Directors In 2
- Page 173 and 174:
Appendix 3: Foreign exchange rates
- Page 175 and 176:
Income Statement of Gorenje, d.d. A
- Page 177 and 178:
Statement of Cash Flows of Gorenje,
- Page 179 and 180:
ANNUAL REPORT 2011 Notes to the Fin
- Page 181 and 182:
ANNUAL REPORT 2011 Impairment losse
- Page 183 and 184:
ANNUAL REPORT 2011 (iv) Depreciatio
- Page 185 and 186:
Financial assets measured at amorti
- Page 187 and 188:
ANNUAL REPORT 2011 (iv) Site restor
- Page 189 and 190:
ANNUAL REPORT 2011 Amendment to IFR
- Page 191 and 192:
ANNUAL REPORT 2011 � additional c
- Page 193 and 194:
ANNUAL REPORT 2011 Note 8 - Revenue
- Page 195 and 196:
ANNUAL REPORT 2011 Note 13 - Other
- Page 197 and 198:
The following deferred tax amounts
- Page 199 and 200:
Movements in intangible assets in 2
- Page 201 and 202:
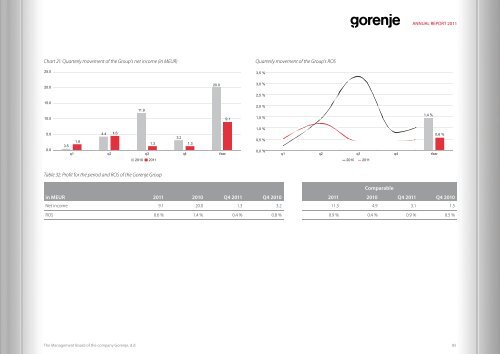
The Management Board of the company
- Page 203 and 204:
Movements in investments in subsidi
- Page 205 and 206:
Tax assets - Tax liabilities Throug
- Page 207 and 208:
Current trade receivables due from
- Page 209 and 210:
ANNUAL REPORT 2011 Note 27 - Cash a
- Page 211 and 212:
ANNUAL REPORT 2011 Note 29 - Determ
- Page 213 and 214:
ANNUAL REPORT 2011 Note 32 - Curren
- Page 215 and 216:
ANNUAL REPORT 2011 Company 2011 201
- Page 217 and 218:
Movements in allowances for trade r
- Page 219 and 220:
The following significant exchange
- Page 221 and 222:
Year 2011 The Management Board of t
- Page 223 and 224:
ANNUAL REPORT 2011 Pursuant to the
- Page 225 and 226:
Gross earnings in the period Januar
- Page 227 and 228:
Note 40 - Events after the date of