

2.8 MEUR - Gorenje - Gorenje Group
2.8 MEUR - Gorenje - Gorenje Group
2.8 MEUR - Gorenje - Gorenje Group

Create successful ePaper yourself
Turn your PDF publications into a flip-book with our unique Google optimized e-Paper software.
of reduced demand for our products. We therefore<br />
welcome all efforts on the part of the state towards<br />
providing adequate legal conditions and changes in<br />
the social climate that would allow companies to more<br />
swiftly adapt their number of employees, and provide<br />
employees with more options for new employment<br />
through adequate programmes for acquiring new skills<br />
and additional training.<br />
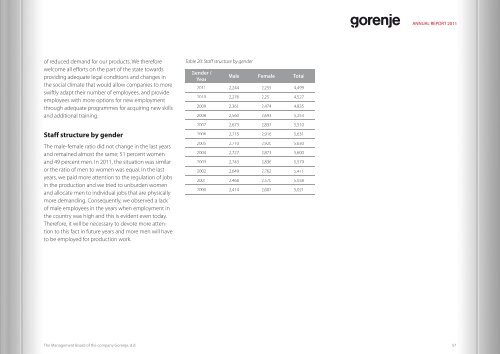
Staff structure by gender<br />
The male-female ratio did not change in the last years<br />
and remained almost the same; 51 percent women<br />
and 49 percent men. In 2011, the situation was similar<br />
or the ratio of men to women was equal. In the last<br />
years, we paid more attention to the regulation of jobs<br />
in the production and we tried to unburden women<br />
and allocate men to individual jobs that are physically<br />
more demanding. Consequently, we observed a lack<br />
of male employees in the years when employment in<br />
the country was high and this is evident even today.<br />
Therefore, it will be necessary to devote more attention<br />
to this fact in future years and more men will have<br />
to be employed for production work.<br />
The Management Board of the company <strong>Gorenje</strong>, d.d.<br />
Table 20: Staff structure by gender<br />
Gender /<br />
Year<br />
Male Female Total<br />
2011 2,244 2,255 4,499<br />
2010 2,276 2,251 4,527<br />
2009 2,361 2,474 4,835<br />
2008 2,560 2,693 5,253<br />
2007 2,673 2,837 5,510<br />
2006 2,715 2,916 5,631<br />
2005 2,710 2,920 5,630<br />
2004 2,727 2,873 5,600<br />
2003 2,743 2,836 5,579<br />
2002 2,649 2,762 5,411<br />
2001 2,468 2,570 5,038<br />
2000 2,414 2,607 5,021<br />
ANNUAL REPORT 2011<br />
57