

2.8 MEUR - Gorenje - Gorenje Group
2.8 MEUR - Gorenje - Gorenje Group
2.8 MEUR - Gorenje - Gorenje Group

You also want an ePaper? Increase the reach of your titles
YUMPU automatically turns print PDFs into web optimized ePapers that Google loves.
Under consideration of the period January – December in<br />
2010, costs of services increased by EUR 20.6 mio or by<br />
13.6 percent, at a comparable level by EUR 5.0 mio or 3.6<br />
percent. This increase is mostly a result of higher costs of<br />
logistics due to a change in the operational sales model in<br />
the Russian market.<br />
Added value per employee improved over the previous<br />
year from EUR 33,482 to EUR 33,848 or by 1.1 percent. As<br />
employee benefits expense growth exceeded the added<br />
value growth, the economic labour productivity (change<br />
in the ratio of added value to labour cost per employee)<br />
dropped by 9.8 percent in view of total generated added<br />
value growth by EUR 3.3 mio (to EUR 301.5 mio). Accord-<br />
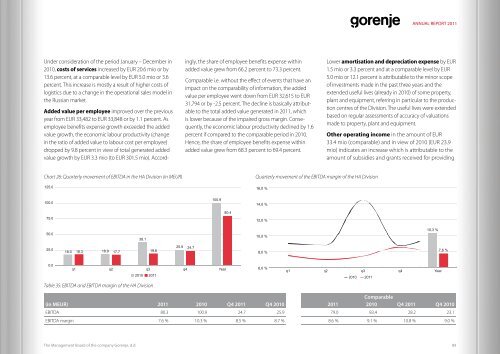
Chart 26: Quarterly movement of EBITDA in the HA Division (in <strong>MEUR</strong>)<br />
125.0<br />
100.0<br />
75.0<br />
50.0<br />
25.0<br />
0.0<br />
18.0<br />
18.3 18.9 17.7 19.6<br />
The Management Board of the company <strong>Gorenje</strong>, d.d.<br />
38.1<br />
25.9<br />
ingly, the share of employee benefits expense within<br />
added value grew from 66.2 percent to 73.3 percent.<br />
Comparable i.e. without the effect of events that have an<br />
impact on the comparability of information, the added<br />
value per employee went down from EUR 32,615 to EUR<br />
31,794 or by -2.5 percent. The decline is basically attributable<br />
to the total added value generated in 2011, which<br />
is lower because of the impaired gross margin. Consequently,<br />
the economic labour productivity declined by 1.6<br />
percent if compared to the comparable period in 2010.<br />
Hence, the share of employee benefits expense within<br />
added value grew from 68.3 percent to 69.4 percent.<br />
24.7<br />
100.9<br />
q1 q2 q3 q4 Year<br />
2010 2011<br />
Table 35: EBITDA and EBITDA margin of the HA Division<br />
80.4<br />
Quarterly movement of the EBITDA margin of the HA Division<br />
16,0 %<br />
14,0 %<br />
12,0 %<br />
10,0 %<br />
8,0 %<br />
6,0 %<br />
ANNUAL REPORT 2011<br />
Lower amortisation and depreciation expense by EUR<br />
1.5 mio or 3.3 percent and at a comparable level by EUR<br />
5.0 mio or 12.1 percent is attributable to the minor scope<br />
of investments made in the past three years and the<br />
extended useful lives (already in 2010) of some property,<br />
plant and equipment, referring in particular to the production<br />
centres of the Division. The useful lives were extended<br />
based on regular assessments of accuracy of valuations<br />
made to property, plant and equipment.<br />
Other operating income in the amount of EUR<br />
33.4 mio (comparable) and in view of 2010 (EUR 23.9<br />
mio) indicates an increase which is attributable to the<br />
amount of subsidies and grants received for providing<br />
10,3 %<br />
q1 q2 q3 q4 Year<br />
2010 2011<br />
(in <strong>MEUR</strong>) 2011 2010 Q4 2011 Q4 2010<br />
2011<br />
Comparable<br />
2010 Q4 2011 Q4 2010<br />
EBITDA 80.3 100.9 24.7 25.9 79.0 83.4 28.2 23.1<br />
EBITDA margin 7.6 % 10.3 % 8.5 % 8.7 % 8.6 % 9.1 % 10.8 % 9.0 %<br />
7,6 %<br />
89