- Page 6:
ACKNOWLEDGEMENTMost of the indigeno
- Page 10:
ABBREVIATIONSAIDSANCARIBCCBDHSCBICB
- Page 14 and 15:
Sl. No. Title Page #CHAPTER XIII HO
- Page 16 and 17:
Sl. No. Title Page #Figure 4.5: Pop
- Page 18 and 19:
Sl. No. Title Page #Figure 22.3: Ho
- Page 20:
Sl. No. Title Page #Box 21.2: Salie
- Page 23 and 24:
HDRCSocio-economic Baseline Survey
- Page 25 and 26:
HDRCSocio-economic Baseline Survey
- Page 27 and 28:
HDRCSocio-economic Baseline Survey
- Page 29 and 30:
HDRCSocio-economic Baseline Survey
- Page 32 and 33:
CHAPTER IINTRODUCTION1.1 Why Studyi
- Page 34 and 35:
HDRCSocio-economic Baseline Survey
- Page 36 and 37:
HDRCSocio-economic Baseline Survey
- Page 38 and 39:
HDRCSocio-economic Baseline Survey
- Page 40 and 41:
HDRCSocio-economic Baseline Survey
- Page 42 and 43:
HDRCSocio-economic Baseline Survey
- Page 44 and 45:
Provide support to Basic Education.
- Page 46 and 47:
HDRCSocio-economic Baseline Survey
- Page 48 and 49:
Z 2 PQn = -------------------------
- Page 50 and 51:
HDRCSocio-economic Baseline Survey
- Page 52 and 53:
HDRCSocio-economic Baseline Survey
- Page 54 and 55:
HDRCSocio-economic Baseline Survey
- Page 56 and 57:
HDRCSocio-economic Baseline Survey
- Page 58:
HDRCSocio-economic Baseline Survey
- Page 61 and 62:
HDRCSocio-economic Baseline Survey
- Page 63 and 64:
HDRCSocio-economic Baseline Survey
- Page 65 and 66:
HDRCSocio-economic Baseline Survey
- Page 67 and 68:
4.6 Dependency RatioHDRCSocio-econo
- Page 69 and 70:
HDRCSocio-economic Baseline Survey
- Page 71 and 72:
HDRCSocio-economic Baseline Survey
- Page 74 and 75:
HDRCSocio-economic Baseline Survey
- Page 76 and 77:
HDRCSocio-economic Baseline Survey
- Page 78 and 79:
HDRCSocio-economic Baseline Survey
- Page 80 and 81:
HDRCSocio-economic Baseline Survey
- Page 82 and 83:
HDRCSocio-economic Baseline Survey
- Page 84 and 85:
HDRCSocio-economic Baseline Survey
- Page 86 and 87:
HDRCSocio-economic Baseline Survey
- Page 88 and 89:
HDRCSocio-economic Baseline Survey
- Page 90 and 91:
HDRCSocio-economic Baseline Survey
- Page 92 and 93:
HDRCSocio-economic Baseline Survey
- Page 94 and 95:
HDRCSocio-economic Baseline Survey
- Page 96 and 97:
HDRCSocio-economic Baseline Survey
- Page 98 and 99: HDRCSocio-economic Baseline Survey
- Page 100 and 101: HDRCSocio-economic Baseline Survey
- Page 102: HDRCSocio-economic Baseline Survey
- Page 105 and 106: HDRCSocio-economic Baseline Survey
- Page 107 and 108: 9.6 Income Earning StatusHDRCSocio-
- Page 109 and 110: HDRCSocio-economic Baseline Survey
- Page 111 and 112: HDRCSocio-economic Baseline Survey
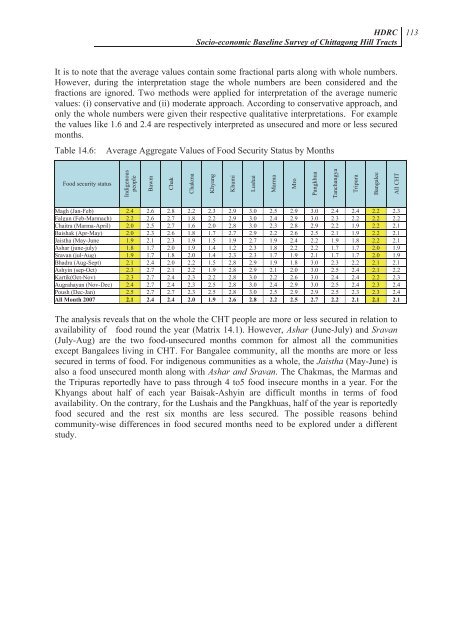
- Page 113 and 114: HDRCSocio-economic Baseline Survey
- Page 115 and 116: HDRCSocio-economic Baseline Survey
- Page 117 and 118: HDRCSocio-economic Baseline Survey
- Page 119 and 120: HDRCSocio-economic Baseline Survey
- Page 121 and 122: HDRCSocio-economic Baseline Survey
- Page 123 and 124: HDRCSocio-economic Baseline Survey
- Page 125 and 126: HDRCSocio-economic Baseline Survey
- Page 128 and 129: HDRCSocio-economic Baseline Survey
- Page 130 and 131: HDRCSocio-economic Baseline Survey
- Page 132 and 133: HDRCSocio-economic Baseline Survey
- Page 134 and 135: HDRCSocio-economic Baseline Survey
- Page 136 and 137: HDRCSocio-economic Baseline Survey
- Page 138 and 139: HDRCSocio-economic Baseline Survey
- Page 140: HDRCSocio-economic Baseline Survey
- Page 143 and 144: HDRCSocio-economic Baseline Survey
- Page 145 and 146: HDRCSocio-economic Baseline Survey
- Page 147: HDRCSocio-economic Baseline Survey
- Page 151 and 152: HDRCSocio-economic Baseline Survey
- Page 154 and 155: 15.1 IntroductionHDRCSocio-economic
- Page 156 and 157: 15.5 Medium of EducationHDRCSocio-e
- Page 158: HDRCSocio-economic Baseline Survey
- Page 161 and 162: HDRCSocio-economic Baseline Survey
- Page 163 and 164: HDRCSocio-economic Baseline Survey
- Page 165 and 166: HDRCSocio-economic Baseline Survey
- Page 167 and 168: HDRCSocio-economic Baseline Survey
- Page 169 and 170: HDRCSocio-economic Baseline Survey
- Page 172 and 173: HDRCSocio-economic Baseline Survey
- Page 174 and 175: HDRCSocio-economic Baseline Survey
- Page 176 and 177: HDRCSocio-economic Baseline Survey
- Page 178 and 179: HDRCSocio-economic Baseline Survey
- Page 180 and 181: HDRCSocio-economic Baseline Survey
- Page 182 and 183: HDRCSocio-economic Baseline Survey
- Page 184 and 185: HDRCSocio-economic Baseline Survey
- Page 186 and 187: HDRCSocio-economic Baseline Survey
- Page 188 and 189: 20.2 Women and DevelopmentHDRCSocio
- Page 190 and 191: HDRCSocio-economic Baseline Survey
- Page 192 and 193: HDRCSocio-economic Baseline Survey
- Page 194 and 195: HDRCSocio-economic Baseline Survey
- Page 196 and 197: HDRCSocio-economic Baseline Survey
- Page 198 and 199:
HDRCSocio-economic Baseline Survey
- Page 200 and 201:
HDRCSocio-economic Baseline Survey
- Page 202 and 203:
HDRCSocio-economic Baseline Survey
- Page 204 and 205:
HDRCSocio-economic Baseline Survey
- Page 206 and 207:
HDRCSocio-economic Baseline Survey
- Page 208 and 209:
HDRCSocio-economic Baseline Survey
- Page 211 and 212:
HDRCSocio-economic Baseline Survey
- Page 213 and 214:
HDRCSocio-economic Baseline Survey
- Page 215 and 216:
HDRCSocio-economic Baseline Survey
- Page 217 and 218:
HDRCSocio-economic Baseline Survey
- Page 219 and 220:
HDRCSocio-economic Baseline Survey
- Page 221:
HDRCSocio-economic Baseline Survey
- Page 224 and 225:
HDRCSocio-economic Baseline Survey
- Page 226 and 227:
HDRCSocio-economic Baseline Survey
- Page 229 and 230:
HDRCSocio-economic Baseline Survey
- Page 231 and 232:
HDRCSocio-economic Baseline Survey
- Page 233 and 234:
HDRCSocio-economic Baseline Survey
- Page 235 and 236:
HDRCSocio-economic Baseline Survey
- Page 237 and 238:
HDRCSocio-economic Baseline Survey
- Page 239 and 240:
HDRCSocio-economic Baseline Survey
- Page 241 and 242:
HDRCSocio-economic Baseline Survey
- Page 243 and 244:
HDRCSocio-economic Baseline Survey
- Page 245 and 246:
HDRCSocio-economic Baseline Survey
- Page 247 and 248:
HDRCSocio-economic Baseline Survey
- Page 249 and 250:
HDRCSocio-economic Baseline Survey
- Page 251 and 252:
HDRCSocio-economic Baseline Survey
- Page 253 and 254:
HDRCSocio-economic Baseline Survey
- Page 255 and 256:
HDRCSocio-economic Baseline Survey
- Page 257 and 258:
HDRCSocio-economic Baseline Survey
- Page 259 and 260:
HDRCSocio-economic Baseline Survey
- Page 261 and 262:
HDRCSocio-economic Baseline Survey
- Page 263 and 264:
HDRCSocio-economic Baseline Survey
- Page 265 and 266:
HDRCSocio-economic Baseline Survey
- Page 267 and 268:
HDRCSocio-economic Baseline Survey
- Page 269 and 270:
HDRCSocio-economic Baseline Survey
- Page 271 and 272:
HDRCSocio-economic Baseline Survey
- Page 273 and 274:
HDRCSocio-economic Baseline Survey
- Page 275 and 276:
HDRCSocio-economic Baseline Survey
- Page 277 and 278:
HDRCSocio-economic Baseline Survey
- Page 279 and 280:
HDRCSocio-economic Baseline Survey
- Page 281 and 282:
HDRCSocio-economic Baseline Survey
- Page 283 and 284:
HDRCSocio-economic Baseline Survey
- Page 285 and 286:
HDRCSocio-economic Baseline Survey
- Page 287 and 288:
HDRCSocio-economic Baseline Survey
- Page 289 and 290:
HDRCSocio-economic Baseline Survey
- Page 291 and 292:
HDRCSocio-economic Baseline Survey
- Page 293 and 294:
HDRCSocio-economic Baseline Survey
- Page 295 and 296:
HDRCSocio-economic Baseline Survey
- Page 297 and 298:
HDRCSocio-economic Baseline Survey
- Page 299 and 300:
HDRCSocio-economic Baseline Survey
- Page 301 and 302:
HDRCSocio-economic Baseline Survey
- Page 303 and 304:
HDRCSocio-economic Baseline Survey
- Page 305:
HDRCSocio-economic Baseline Survey
- Page 309 and 310:
HDRCSocio-economic Baseline Survey
- Page 311 and 312:
HDRCSocio-economic Baseline Survey
- Page 313 and 314:
HDRCSocio-economic Baseline Survey
- Page 315 and 316:
HDRCSocio-economic Baseline Survey
- Page 317 and 318:
HDRCSocio-economic Baseline Survey
- Page 319 and 320:
HDRCSocio-economic Baseline Survey
- Page 321 and 322:
HDRCSocio-economic Baseline Survey
- Page 323 and 324:
HDRCSocio-economic Baseline Survey
- Page 325 and 326:
HDRCSocio-economic Baseline Survey
- Page 327 and 328:
HDRCSocio-economic Baseline Survey
- Page 329 and 330:
HDRCSocio-economic Baseline Survey
- Page 331 and 332:
HDRCSocio-economic Baseline Survey
- Page 333 and 334:
HDRCSocio-economic Baseline Survey
- Page 335 and 336:
HDRCSocio-economic Baseline Survey
- Page 337 and 338:
HDRCSocio-economic Baseline Survey
- Page 339 and 340:
HDRCSocio-economic Baseline Survey
- Page 341 and 342:
HDRCSocio-economic Baseline Survey
- Page 343:
HDRCSocio-economic Baseline Survey
- Page 347 and 348:
HDRCSocio-economic Baseline Survey
- Page 349 and 350:
HDRCSocio-economic Baseline Survey
- Page 351:
HDRCSocio-economic Baseline Survey
- Page 354 and 355:
HDRCSocio-economic Baseline Survey


