Socio-economic Baseline Survey of Chittagong Hill Tracts - chtdf
Socio-economic Baseline Survey of Chittagong Hill Tracts - chtdf
Socio-economic Baseline Survey of Chittagong Hill Tracts - chtdf
- No tags were found...

Create successful ePaper yourself
Turn your PDF publications into a flip-book with our unique Google optimized e-Paper software.
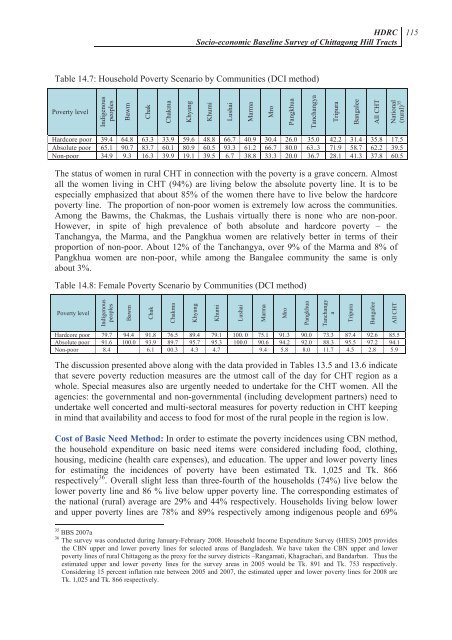
HDRC<strong>Socio</strong>-<strong>economic</strong> <strong>Baseline</strong> <strong>Survey</strong> <strong>of</strong> <strong>Chittagong</strong> <strong>Hill</strong> <strong>Tracts</strong>115Table 14.7: Household Poverty Scenario by Communities (DCI method)Poverty levelIndigenouspeoplesBawmChakChakmaKhyangKhumiLushaiMarmaMroPangkhuaTanchangyaTripuraBangaleeAll CHTNational(rural) 35Hardcore poor 39.4 64.8 63.3 33.9 59.6 48.8 66.7 40.9 30.4 26.0 35.0 42.2 31.4 35.8 17.5Absolute poor 65.1 90.7 83.7 60.1 80.9 60.5 93.3 61.2 66.7 80.0 63..3 71.9 58.7 62.2 39.5Non-poor 34.9 9.3 16.3 39.9 19.1 39.5 6.7 38.8 33.3 20.0 36.7 28.1 41.3 37.8 60.5The status <strong>of</strong> women in rural CHT in connection with the poverty is a grave concern. Almostall the women living in CHT (94%) are living below the absolute poverty line. It is to beespecially emphasized that about 85% <strong>of</strong> the women there have to live below the hardcorepoverty line. The proportion <strong>of</strong> non-poor women is extremely low across the communities.Among the Bawms, the Chakmas, the Lushais virtually there is none who are non-poor.However, in spite <strong>of</strong> high prevalence <strong>of</strong> both absolute and hardcore poverty – theTanchangya, the Marma, and the Pangkhua women are relatively better in terms <strong>of</strong> theirproportion <strong>of</strong> non-poor. About 12% <strong>of</strong> the Tanchangya, over 9% <strong>of</strong> the Marma and 8% <strong>of</strong>Pangkhua women are non-poor, while among the Bangalee community the same is onlyabout 3%.Table 14.8: Female Poverty Scenario by Communities (DCI method)Poverty levelIndigenouspeoplesBawmChakChakmaKhyangKhumiLushaiMarmaMroPangkhuaTanchangyaTripuraBangaleeAll CHTHardcore poor 79.7 94.4 91.8 76.5 89.4 79.1 100. 0 75.1 91.3 90.0 73.3 87.4 92.6 85.5Absolute poor 91.6 100.0 93.9 89.7 95.7 95.3 100.0 90.6 94.2 92.0 88.3 95.5 97.2 94.1Non-poor 8.4 6.1 00.3 4.3 4.7 9.4 5.8 8.0 11.7 4.5 2.8 5.9The discussion presented above along with the data provided in Tables 13.5 and 13.6 indicatethat severe poverty reduction measures are the utmost call <strong>of</strong> the day for CHT region as awhole. Special measures also are urgently needed to undertake for the CHT women. All theagencies: the governmental and non-governmental (including development partners) need toundertake well concerted and multi-sectoral measures for poverty reduction in CHT keepingin mind that availability and access to food for most <strong>of</strong> the rural people in the region is low.Cost <strong>of</strong> Basic Need Method: In order to estimate the poverty incidences using CBN method,the household expenditure on basic need items were considered including food, clothing,housing, medicine (health care expenses), and education. The upper and lower poverty linesfor estimating the incidences <strong>of</strong> poverty have been estimated Tk. 1,025 and Tk. 866respectively 36 . Overall slight less than three-fourth <strong>of</strong> the households (74%) live below thelower poverty line and 86 % live below upper poverty line. The corresponding estimates <strong>of</strong>the national (rural) average are 29% and 44% respectively. Households living below lowerand upper poverty lines are 78% and 89% respectively among indigenous people and 69%35 BBS 2007a36 The survey was conducted during January-February 2008. Household Income Expenditure <strong>Survey</strong> (HIES) 2005 providesthe CBN upper and lower poverty lines for selected areas <strong>of</strong> Bangladesh. We have taken the CBN upper and lowerpoverty lines <strong>of</strong> rural <strong>Chittagong</strong> as the proxy for the survey districts –Rangamati, Khagrachari, and Bandarban. Thus theestimated upper and lower poverty lines for the survey areas in 2005 would be Tk. 891 and Tk. 753 respectively.Considering 15 percent inflation rate between 2005 and 2007, the estimated upper and lower poverty lines for 2008 areTk. 1,025 and Tk. 866 respectively.