- Page 1 and 2: PROGRESS REPORT2007Nuclear Fusion a
- Page 3 and 4: ContentsPART I - FUSION PROGRAMME 7
- Page 5 and 6: 2007PART IV - MISCELLANEOUS 18314.
- Page 7: 2007analyses of the missions to be
- Page 10 and 11: Fusion Programme2007 Progress Repor
- Page 12 and 13: Fusion ProgrammeTable 1.I - Summary
- Page 14 and 15: Fusion ProgrammeFollowing a Europea
- Page 16 and 17: Fusion Programmen e (10 20 m -3 )3.
- Page 18 and 19: Fusion Programme2007 Progress Repor
- Page 20 and 21: Fusion Programmewas not affected by
- Page 22 and 23: Fusion ProgrammeShear Alfvén wavec
- Page 24 and 25: Fusion Programmen H (10 20 /m 3 )0.
- Page 26 and 27: Fusion Programmei.e., typically, ra
- Page 28 and 29: Fusion ProgrammeENEA has provided t
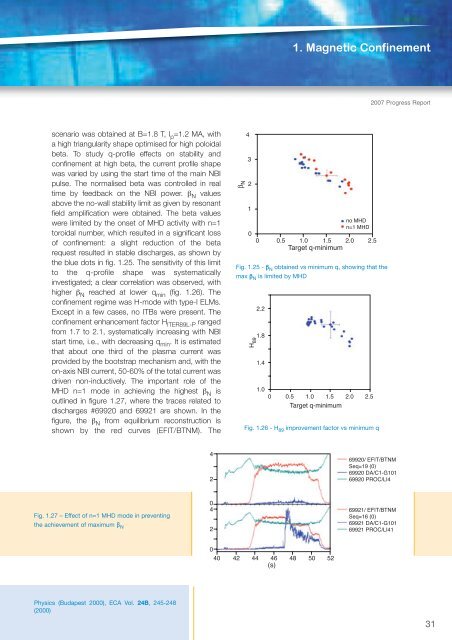
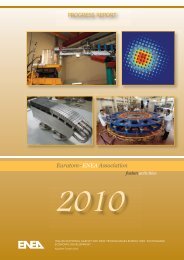
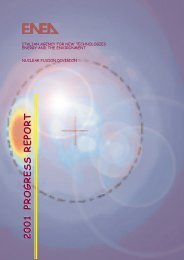
- Page 30 and 31: Fusion Programmennα6 LIF6 LIF9 BeI
- Page 34 and 35: Fusion Programmedifference between
- Page 36 and 37: Fusion ProgrammeIntroductionThe suc
- Page 38 and 39: Fusion ProgrammeMinority ions, acce
- Page 40 and 41: Fusion ProgrammeThe cryostat overal
- Page 42 and 43: Fusion ProgrammeIntroductionThe tec
- Page 44 and 45: Fusion ProgrammeThe main results so
- Page 46 and 47: Fusion ProgrammeInfrared absorption
- Page 48 and 49: Fusion ProgrammeFig. 3.8 - Frascati
- Page 50 and 51: Fusion ProgrammeThe second year of
- Page 52 and 53: 250Fusion Programmeflow-rate in the
- Page 54 and 55: Fusion ProgrammeThe aim of the work
- Page 56 and 57: Fusion ProgrammeFig. 3.21 - X-ray s
- Page 58 and 59: Fusion ProgrammeRange (mm)593583573
- Page 60 and 61: Fusion ProgrammeZ (m)6420-2-4-6sour
- Page 62 and 63: Fusion Programmea) b)c)Fig. 3.31 -
- Page 64 and 65: Fusion Programmeactivation. Eight r
- Page 66 and 67: Fusion Programme1×10 -6Tensile cre
- Page 68 and 69: Fusion ProgrammeAcc V Spot Magn Det
- Page 70 and 71: Fusion Programmelubricants cannot b
- Page 72 and 73: Fusion ProgrammeTritium roomTritium
- Page 74 and 75: Fusion ProgrammeImplications for PS
- Page 76 and 77: Fusion ProgrammeThe development and
- Page 78 and 79: Fusion ProgrammeIntroductionDuring
- Page 80 and 81: Fusion Programme19.5Section view B-
- Page 82 and 83:
Fusion Programmeresults and particu
- Page 84 and 85:
Fusion ProgrammeFollowing the exten
- Page 86 and 87:
Fusion Programme4.7 Characterisatio
- Page 88 and 89:
Fusion ProgrammeMagnetic moment (em
- Page 90 and 91:
Fusion ProgrammeCeO 2YSZCeO 2YBCOMa
- Page 92 and 93:
Fusion Programme0 1 10 0 1 100 1 10
- Page 94 and 95:
Fusion ProgrammeLoad (mN)0.80.60.40
- Page 96 and 97:
Fusion Programme5.1 Outline and Ove
- Page 98 and 99:
Fusion Programme(λ D /Δ 0 ) 2Δ 0
- Page 101 and 102:
5. Inertial Fusion2007 Progress Rep
- Page 103 and 104:
6. Communication and Relationswith
- Page 105 and 106:
7. Publications and Events - Fusion
- Page 107 and 108:
7. Publications and Events - Fusion
- Page 109 and 110:
7. Publications and Events - Fusion
- Page 111 and 112:
7. Publications and Events - Fusion
- Page 113:
7. Publications and Events - Fusion
- Page 116 and 117:
Fission Technology8.1 Advanced and
- Page 118 and 119:
Fission TechnologyAcceleration m/s
- Page 120 and 121:
Fission Technology232.73 mm (17 pin
- Page 122 and 123:
Fission TechnologyThe Very High Tem
- Page 124 and 125:
Fission Technology500Thermocouple t
- Page 126 and 127:
Fission Technology0.16 mm 0.16 mm0.
- Page 128 and 129:
Fission Technology-4800-85000.00SGU
- Page 130 and 131:
Fission Technologythrough calculati
- Page 132 and 133:
Fission Technology1.23 e+001.17 e+0
- Page 134 and 135:
Fission TechnologyPressure (bar)642
- Page 136 and 137:
Fission TechnologyFig. 8.37 - Creep
- Page 138 and 139:
Fission TechnologyENEA organised th
- Page 140 and 141:
Fission TechnologyTemperature600400
- Page 142 and 143:
Fission TechnologyZ(m)1.00.80.60.40
- Page 144 and 145:
Fission Technologythat a system is
- Page 146 and 147:
Fission TechnologyMaxwellian-averag
- Page 148 and 149:
Fission TechnologyBOT3P has large w
- Page 150 and 151:
Fission Technology9.1 Boron Neutron
- Page 152 and 153:
Fission TechnologyIn collaboration
- Page 154 and 155:
Fission Technologyvolume. Thus the
- Page 156 and 157:
Fission TechnologyFig. 9.9 - Logger
- Page 158 and 159:
Fission TechnologyIn relation to EN
- Page 160 and 161:
Fission TechnologyArticles11.1 Publ
- Page 162 and 163:
Fission TechnologyArticles incourse
- Page 164 and 165:
Fission TechnologyF. ROELOFS, B. DE
- Page 166 and 167:
Fission TechnologyE. BERTHOUMIEUX e
- Page 168 and 169:
Fission TechnologyInternal reportsR
- Page 170 and 171:
Fission TechnologyRTI FPN-P815-008
- Page 173 and 174:
PART IIINUCLEAR PROTECTION171
- Page 175 and 176:
12. Radioactive Waste Management an
- Page 177 and 178:
12. Radioactive Waste Management an
- Page 179 and 180:
12. Radioactive Waste Management an
- Page 181 and 182:
12. Radioactive Waste Management an
- Page 183:
13. Publications - Nuclear Protecti
- Page 186 and 187:
Miscellaneous14.1 Advances in the I
- Page 188 and 189:
Miscellaneoususing a full wave code
- Page 190 and 191:
MiscellaneousAt present the effect
- Page 192 and 193:
MiscellaneousSuperAGILE view of the
- Page 194 and 195:
Abbreviations and AcronymsAacACPADS
- Page 196 and 197:
Abbreviations and AcronymsEFITEHRSE
- Page 198 and 199:
Abbreviations and AcronymsITERITGIT
- Page 200 and 201:
Abbreviations and AcronymsPFWPGAPHY
- Page 202:
Abbreviations and AcronymsVVDEVELLA