Fusion Programme - ENEA - Fusione
Fusion Programme - ENEA - Fusione
Fusion Programme - ENEA - Fusione
- No tags were found...

You also want an ePaper? Increase the reach of your titles
YUMPU automatically turns print PDFs into web optimized ePapers that Google loves.
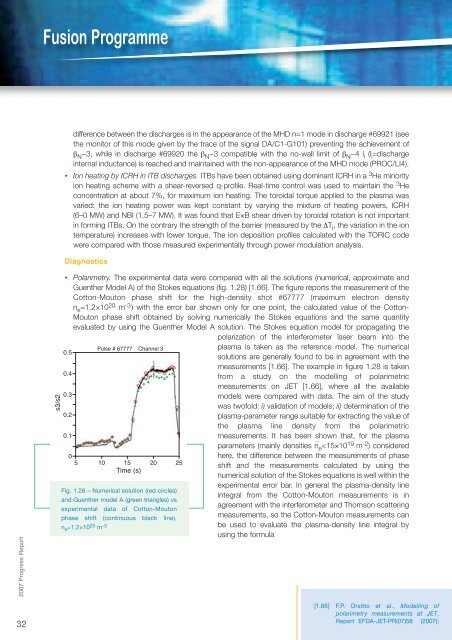
<strong>Fusion</strong> <strong>Programme</strong>difference between the discharges is in the appearance of the MHD n=1 mode in discharge #69921 (seethe monitor of this mode given by the trace of the signal DA/C1-G101) preventing the achievement ofβ N ~3, while in discharge #69920 the β N ~3 compatible with the no-wall limit of β N ~4 l i (l i =dischargeinternal inductance) is reached and maintained with the non-appearance of the MHD mode (PROC/LI4).• Ion heating by ICRH in ITB discharges. ITBs have been obtained using dominant ICRH in a 3 He minorityion heating scheme with a shear-reversed q-profile. Real-time control was used to maintain the 3 Heconcentration at about 7%, for maximum ion heating. The toroidal torque applied to the plasma wasvaried: the ion heating power was kept constant by varying the mixture of heating powers, ICRH(6–0 MW) and NBI (1.5–7 MW). It was found that E×B shear driven by toroidal rotation is not importantin forming ITBs. On the contrary the strength of the barrier (measured by the ΔT i , the variation in the iontemperature) increases with lower torque. The ion deposition profiles calculated with the TORIC codewere compared with those measured experimentally through power modulation analysis.Diagnostics2007 Progress Report32s3/s2• Polarimetry. The experimental data were compared with all the solutions (numerical, approximate andGuenther Model A) of the Stokes equations (fig. 1.28) [1.66]. The figure reports the measurement of theCotton-Mouton phase shift for the high-density shot #67777 (maximum electron densityn e =1.2×10 20 m -3 ) with the error bar shown only for one point, the calculated value of the Cotton-Mouton phase shift obtained by solving numerically the Stokes equations and the same quantityevaluated by using the Guenther Model A solution. The Stokes equation model for propagating thepolarization of the interferometer laser beam into the0.50.40.30.20.10Pulse # 67777 Channel 35 10 15 20 25Time (s)Fig. 1.28 – Numerical solution (red circles)and Guenther model A (green triangles) vsexperimental data of Cotton-Moutonphase shift (continuous black line),n e =1.2×10 20 m -3plasma is taken as the reference model. The numericalsolutions are generally found to be in agreement with themeasurements [1.66]. The example in figure 1.28 is takenfrom a study on the modelling of polarimetricmeasurements on JET [1.66], where all the availablemodels were compared with data. The aim of the studywas twofold: i) validation of models; ii) determination of theplasma-parameter range suitable for extracting the value ofthe plasma line density from the polarimetricmeasurements. It has been shown that, for the plasmaparameters (mainly densities n _ e