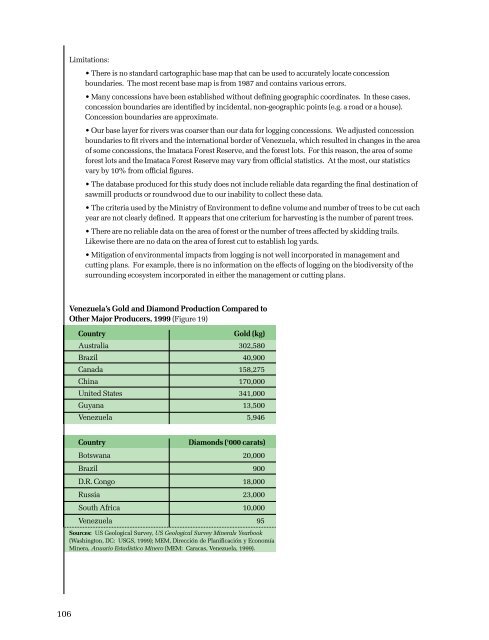
Limitations:• There is no standard cartographic base map that can be used to accurately locate concessionboundaries. The most recent base map is from 1987 and contains various errors.• Many concessions have been established without defining geographic coordinates. In these cases,concession boundaries are identified by incidental, non-geographic points (e.g. a road or a house).Concession boundaries are approximate.• Our base layer for rivers was coarser than our data for logging concessions. We adjusted concessionboundaries to fit rivers and the international border of Venezuela, which resulted in changes in the areaof some concessions, the Imataca Forest Reserve, and the forest lots. For this reason, the area of someforest lots and the Imataca Forest Reserve may vary from official statistics. At the most, our statisticsvary by 10% from official figures.• The database produced for this study does not include reliable data regarding the final destination ofsawmill products or roundwood due to our inability to collect these data.• The criteria used by the Ministry of Environment to define volume and number of trees to be cut eachyear are not clearly defined. It appears that one criterium for harvesting is the number of parent trees.• There are no reliable data on the area of forest or the number of trees affected by skidding trails.Likewise there are no data on the area of forest cut to establish log yards.• Mitigation of environmental impacts from logging is not well incorporated in management andcutting plans. For example, there is no information on the effects of logging on the biodiversity of thesurrounding ecosystem incorporated in either the management or cutting plans.Venezuela’s Gold and Diamond Production Compared toOther Major Producers, 1999 (Figure 19)CountryGold (kg)Australia 302,580Brazil 40,900Canada 158,275China 170,000United States 341,000Guyana 13,500Venezuela 5,946CountryDiamonds (‘000 carats)Botswana 20,000Brazil 900D.R. Congo 18,000Russia 23,000South Africa 10,000Venezuela 95Sources: US Geological Survey, US Geological Survey Minerals Yearbook(Washington, DC: USGS, 1999); MEM, Dirección de Planificación y EconomíaMinera, Anuario Estadístico Minero (MEM: Caracas, Venezuela, 1999).106
Price of Gold, 1975-2000 (Figure 20)YearAverage $/oz.1975 515.31976 378.21977 420.61978 509.61979 728.71980 1281.91981 871.51982 684.81983 733.51984 596.71985 507.51986 578.01987 675.71988 636.11989 529.21990 507.01991 457.71992 422.11993 429.01994 446.01995 433.81996 425.91997 355.01998 310.51999 288.42000 279.0Note: Prices were adjusted for average inflation(indexed to 2000 U.S. dollars).Sources: The Gold Institute, Online at:http://www.kitco.com/charts/historicalgold.html;World Gold Council, “Gold Demand Up 11% in Q42000,” Gold Demand Trends 34, Feb. 2001, Online at:http://www.gold.org/Gedt/Gdt34/Gdt34.pdf (June 28,2001); Inflation data from International MonetaryFund, “World Economic Outlook Database,” May2001. Online athttp://www.imf.org/external/pubs/ft/weo/2001/01/data/index.htm (July 10, 2001).Venezuelan Gold and Diamond Production,1989-1999 (Figure 21)Year Gold (kg) Diamonds (‘000 carats)1989 5,113 2131990 6,334 3371991 4,220 2141992 8,547 4781993 8,985 4111994 10,094 5831995 7,259 2961996 x,xxx 1721997 22,322 2481998 6,740 971999 5,946 95Source: MEM, Dirección General de Planificación y EconomíaMinera, Anuario Estadístico Minero (Caracas, Venezuela: MEM,1999).107
- Page 2 and 3:
The State of Venezuela’s ForestsA
- Page 5:
PresentationMan has become increasi
- Page 9 and 10:
ForewordForests help to slow global
- Page 11 and 12:
AcknowledgmentsGlobal Forest Watch
- Page 13 and 14:
Mining ............................
- Page 15 and 16:
6. Actual and Potential Conflicts B
- Page 18 and 19:
Key FindingsVenezuela is still home
- Page 20 and 21:
However, the forests of the Guayana
- Page 22 and 23:
2Political and Administrative Bound
- Page 24:
MAP 2Settlements in the Forests of
- Page 27 and 28:
In 1998, the Venezuelan Forest Serv
- Page 29 and 30:
Legal Instrument Year RelevanceDecr
- Page 31 and 32:
CHAPTER 2Forest Cover and Protectio
- Page 33 and 34:
13Forest CoverMAP 3Data on forest c
- Page 35 and 36:
• Lack of consistency in results.
- Page 37 and 38:
17Areas Strictly Protected for Cons
- Page 39 and 40:
Areas protected for natural resourc
- Page 41 and 42:
Actual and Potential Conflicts Betw
- Page 43 and 44:
Capacity to Manage Protected Areas
- Page 45 and 46:
CHAPTER 3Non-Extractive Value of Fo
- Page 47 and 48:
Wildlife Species Richness in the Gu
- Page 49 and 50:
Threatened and Endemic Species by S
- Page 51 and 52:
At least thirteen plants and animal
- Page 53 and 54:
The capture and collection of parro
- Page 55 and 56:
CHAPTER 4Forest Development TrendsV
- Page 57 and 58:
Imports, Exports, and National Prod
- Page 59 and 60:
Industrial Wood Production, 1980-19
- Page 61 and 62:
• In 1997, royalties and fees com
- Page 63 and 64:
Status of Logging Concessions in th
- Page 65 and 66:
Irregularities in Logging Concessio
- Page 67 and 68:
Low extraction rates in the Guayana
- Page 69 and 70:
The Guayana region lacks a transpar
- Page 71 and 72:
The capacity for regeneration of co
- Page 73 and 74:
MiningWhat is the relative importan
- Page 75 and 76: Venezuelan Gold and Diamond Product
- Page 77 and 78: • Concession owners are required
- Page 79 and 80: Foreign Mining Companies with Holdi
- Page 81 and 82: By nature, mining is a speculative
- Page 83 and 84: signs of contamination, 97 and anot
- Page 85 and 86: SettlementsHow are settlement patte
- Page 87 and 88: What is the impact of population ch
- Page 89 and 90: y these actors. In addition, becaus
- Page 91 and 92: CHAPTER 5ConclusionsGlobal Forest W
- Page 93 and 94: Providing Better Information for In
- Page 95 and 96: 18 Ministerio del Ambiente y de los
- Page 97 and 98: 37 MARN, Boletín Estadístico Fore
- Page 99 and 100: 62 R. Posada, “Algunos aspectos s
- Page 101 and 102: 83 Government of Venezuela (GOV), D
- Page 103 and 104: 103 Legislation does not define sta
- Page 105 and 106: Methodology:• Data on the locatio
- Page 107 and 108: • TREES from ATSR onboard the ERS
- Page 109 and 110: Maps 4-6, Figures 2-4Venezuela’s
- Page 111 and 112: • There are differences between t
- Page 113 and 114: Wildlife Restricted to Forests of t
- Page 115 and 116: Threatened Animals Used by Indigeno
- Page 117 and 118: Chapter 4: Forest Development Trend
- Page 119 and 120: Note: There are many inconsistencie
- Page 121 and 122: Annual Cutting Plans (Executed)Area
- Page 123 and 124: Management Area (ha) Contract Years
- Page 125: Table Sources:• Concession manage
- Page 129 and 130: Methodology (Figure 23, Table 11, M
- Page 131 and 132: Change in Selected Indigenous Popul
- Page 133 and 134: iar with forest issues in Venezuela
- Page 135 and 136: Gydris Adrián Comisión Especial p
- Page 137 and 138: Ortegano, O. “Nueva Política For
- Page 139 and 140: Chapter 3: Non-timber Forest Produc
- Page 141 and 142: Dessene, P., and S. Strhal. “Situ
- Page 143 and 144: Hernández, L., P. Williams, R. Azu
- Page 145 and 146: Ojasti, J. “Fauna silvestre del e
- Page 147 and 148: Técnica Minera C.A. Inventario de
- Page 149 and 150: Nepstad, D., et al. “Large-scale
- Page 151 and 152: Government Industry Task Force on t
- Page 153 and 154: All data presented in this report a
- Page 155: GLOBAL FOREST WATCH (GFW)WORLD RESO