Australasian Anaesthesia 2011 - Australian and New Zealand ...
Australasian Anaesthesia 2011 - Australian and New Zealand ...
Australasian Anaesthesia 2011 - Australian and New Zealand ...

Create successful ePaper yourself
Turn your PDF publications into a flip-book with our unique Google optimized e-Paper software.
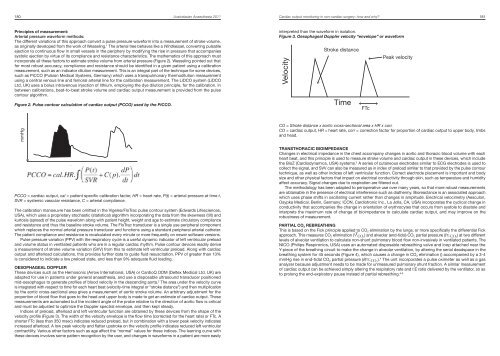
180 <strong>Australasian</strong> <strong>Anaesthesia</strong> <strong>2011</strong>Cardiac output monitoring in non-cardiac surgery: how <strong>and</strong> why? 181Principles of measurement:Arterial pressure waveform methods:The different variations of this approach convert a pulse pressure waveform into a measurement of stroke volume,as originally developed from the work of Wesseling. 1 The arterial tree behaves like a Windkessel, converting pulsatileejection to continuous flow in small vessels in the periphery by modifying the rise in pressure that accompaniessystolic ejection by virtue of its compliance <strong>and</strong> resistance characteristics. The mathematics of this approach mustincorporate all these factors to estimate stroke volume from arterial pressure (Figure 2). Wesseling pointed out thatfor most robust accuracy, compliance <strong>and</strong> resistance should be identified in a given patient using a calibrationmeasurement, such as an indicator dilution measurement. This is an integral part of the technique for some devices,such as PiCCO (Pulsion Medical Systems, Germany) which uses a transpulmonary thermodilution measurementusing a central venous line <strong>and</strong> femoral arterial line for the calibration measurement. The LiDCO system (LiDCOLtd, UK) uses a bolus intravenous injection of lithium, employing the dye dilution principle, for the calibration. Inbetween calibrations, beat-to-beat stroke volume <strong>and</strong> cardiac output measurement is provided from the pulsecontour algorithm.Figure 2. Pulse contour calculation of cardiac output (PCCO) used by the PiCCO.interpreted than the waveform in isolation.Figure 3. Oesophageal Doppler velocity “envelope” or waveformVelocityStroke distanceTimeFTcPeak velocitymmHg≈TimePCCO = cardiac output, cal = patient specific calibration factor, HR = heart rate, P(t) = arterial pressure at time t,SVR = systemic vascular resistance, C = arterial compliance.The calibration manoeuvre has been omitted in the Vigeleo/FloTrac pulse contour system (Edwards Lifesciences,USA), which uses a proprietary stochastic (statistical) algorithm incorporating the data from the skewness (tilt) <strong>and</strong>kurtosis (spread) of the pulse waveform along with patient height, weight <strong>and</strong> age to estimate circulatory compliance<strong>and</strong> resistance <strong>and</strong> thus the baseline stroke volume. The FloTrac transducer is a single use peripheral componentwhich replaces the normal arterial pressure transducer <strong>and</strong> functions using a st<strong>and</strong>ard peripheral arterial catheter.The patient compliance <strong>and</strong> resistance is recalculated every minute or more frequently on newer software versions.Pulse pressure variation (PPV) with the respiratory cycle is a useful dynamic indicator of left ventricular preload<strong>and</strong> volume status in ventilated patients who are in a regular cardiac rhythm. Pulse contour devices readily derivea measurement of stroke volume variation (SVV) from this to estimate left ventricular preload. Along with cardiacoutput <strong>and</strong> afterload calculations, this provides further data to guide fluid resuscitation. PPV of greater than 13%is considered to indicate a low preload state, <strong>and</strong> less than 9% adequate fluid loading.OESOPHAGEAL DOPPLERThese devices such as the Hemosonic (Arrow International, USA) or CardioQ ODM (Deltex Medical Ltd. UK) areadapted for use in patients under general anaesthesia, <strong>and</strong> use a disposable ultrasound transducer positionedmid-oesophagus to generate profiles of blood velocity in the descending aorta. 2 The area under the velocity curveis integrated with respect to time for each heart beat (velocity-time integral or “stroke distance”) <strong>and</strong> then multiplicationby the aortic cross-sectional area gives a measurement of aortic stroke volume. An arbitrary adjustment for theproportion of blood flow that goes to the head <strong>and</strong> upper body is made to get an estimate of cardiac output. Thesemeasurements are automated but the incident angle of the probe relative to the direction of aortic flow is critical<strong>and</strong> must be adjusted to optimize the Doppler spectral envelope, <strong>and</strong> then kept steady.Indices of preload, afterload <strong>and</strong> left ventricular function are obtained by these devices from the shape of thevelocity profile (Figure 3). The width of the velocity envelope is the flow time (corrected for the heart rate) or FTc. Ashorter FTc (less than 350 msec) indicates reduced preload, but in combination with a lower peak velocity indicatesincreased afterload. A low peak velocity <strong>and</strong> flatter upstroke on the velocity profile indicates reduced left ventricularcontractility. Various other factors such as age affect the “normal” values for these indices. The learning curve withthese devices involves some pattern recognition by the user, <strong>and</strong> changes in waveforms in a patient are more easilyCO = Stroke distance x aortic cross-sectional area x HR x corr.CO = cardiac output, HR = heart rate, corr = correction factor for proportion of cardiac output to upper body, limbs<strong>and</strong> head.TRANSTHORACIC BIOIMPEDANCEChanges in electrical impedance in the chest accompany changes in aortic <strong>and</strong> thoracic blood volume with eachheart beat, <strong>and</strong> this principle is used to measure stroke volume <strong>and</strong> cardiac output in these devices, which includethe BioZ (Cardiodynamics, USA) systems. 3 A series of cutaneous electrodes similar to ECG electrodes is used tocollect the signal, <strong>and</strong> SVV can also be measured as in index of preload similar to that provided by the pulse contourtechnique, as well as other indices of left ventricular function. Correct electrode placement is important <strong>and</strong> bodysize <strong>and</strong> other physical factors that impact on electrical conductivity through skin, such as temperature <strong>and</strong> humidityaffect accuracy. Signal changes due to respiration are filtered out.The methodology has been adapted to perioperative use over many years, so that more robust measurementsare obtainable in the presence of electrical interference such as diathermy. Bioreactance is an associated approachwhich uses phase shifts in oscillating current rather than changes in amplitude. Electrical velocimetry (Aesculon,Osypka Medical, Berlin, Germany; ICON, Cardiotronic Inc., La Jolla, CA, USA) incorporates the cyclical change inconductivity that accompanies the change in orientation of erythrocytes that occurs from systole to diastole <strong>and</strong>interprets the maximum rate of change of bioimpedance to calculate cardiac output, <strong>and</strong> may improve on therobustness of measurement.PARTIAL CO 2 REBREATHINGThis is based on the Fick principle applied to CO 2 elimination by the lungs, or more specifically the differential Fickapproach. This measures CO 2 elimination (V Y CO 2) <strong>and</strong> alveolar (end-tidal) CO 2 partial pressure (PE’ CO 2) at two differentlevels of alveolar ventilation to calculate non-shunt pulmonary blood flow non-invasively in ventilated patients. TheNICO (Philips Respironics, USA) uses an automated disposable rebreathing valve <strong>and</strong> loop attached near theY-piece of the breathing circuit to make the change in alveolar ventilation, by altering the serial deadspace in thebreathing system for 45 seconds (Figure 4), which causes a change in CO 2 elimination () accompanied by a 3-4mmHg rise in end-tidal CO 2 partial pressure (∂PE’ CO 2). 4 The unit incorporates a pulse oximeter as well as a gasanalyzer because adjustment needs to be made for unmeasured pulmonary shunt fraction. A similar measurementof cardiac output can be achieved simply altering the respiratory rate <strong>and</strong> I:E ratio delivered by the ventilator, so asto prolong the end-expiratory pause instead of partial rebreathing. 5,6