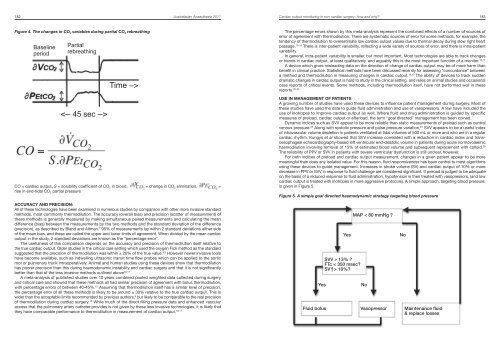
180 <strong>Australasian</strong> <strong>Anaesthesia</strong> <strong>2011</strong>Cardiac output monitoring in non-cardiac surgery: how <strong>and</strong> why? 181Principles of measurement:Arterial pressure waveform methods:The different variations of this approach convert a pulse pressure waveform into a measurement of stroke volume,as originally developed from the work of Wesseling. 1 The arterial tree behaves like a Windkessel, converting pulsatileejection to continuous flow in small vessels in the periphery by modifying the rise in pressure that accompaniessystolic ejection by virtue of its compliance <strong>and</strong> resistance characteristics. The mathematics of this approach mustincorporate all these factors to estimate stroke volume from arterial pressure (Figure 2). Wesseling pointed out thatfor most robust accuracy, compliance <strong>and</strong> resistance should be identified in a given patient using a calibrationmeasurement, such as an indicator dilution measurement. This is an integral part of the technique for some devices,such as PiCCO (Pulsion Medical Systems, Germany) which uses a transpulmonary thermodilution measurementusing a central venous line <strong>and</strong> femoral arterial line for the calibration measurement. The LiDCO system (LiDCOLtd, UK) uses a bolus intravenous injection of lithium, employing the dye dilution principle, for the calibration. Inbetween calibrations, beat-to-beat stroke volume <strong>and</strong> cardiac output measurement is provided from the pulsecontour algorithm.Figure 2. Pulse contour calculation of cardiac output (PCCO) used by the PiCCO.interpreted than the waveform in isolation.Figure 3. Oesophageal Doppler velocity “envelope” or waveformVelocityStroke distanceTimeFTcPeak velocitymmHg≈TimePCCO = cardiac output, cal = patient specific calibration factor, HR = heart rate, P(t) = arterial pressure at time t,SVR = systemic vascular resistance, C = arterial compliance.The calibration manoeuvre has been omitted in the Vigeleo/FloTrac pulse contour system (Edwards Lifesciences,USA), which uses a proprietary stochastic (statistical) algorithm incorporating the data from the skewness (tilt) <strong>and</strong>kurtosis (spread) of the pulse waveform along with patient height, weight <strong>and</strong> age to estimate circulatory compliance<strong>and</strong> resistance <strong>and</strong> thus the baseline stroke volume. The FloTrac transducer is a single use peripheral componentwhich replaces the normal arterial pressure transducer <strong>and</strong> functions using a st<strong>and</strong>ard peripheral arterial catheter.The patient compliance <strong>and</strong> resistance is recalculated every minute or more frequently on newer software versions.Pulse pressure variation (PPV) with the respiratory cycle is a useful dynamic indicator of left ventricular preload<strong>and</strong> volume status in ventilated patients who are in a regular cardiac rhythm. Pulse contour devices readily derivea measurement of stroke volume variation (SVV) from this to estimate left ventricular preload. Along with cardiacoutput <strong>and</strong> afterload calculations, this provides further data to guide fluid resuscitation. PPV of greater than 13%is considered to indicate a low preload state, <strong>and</strong> less than 9% adequate fluid loading.OESOPHAGEAL DOPPLERThese devices such as the Hemosonic (Arrow International, USA) or CardioQ ODM (Deltex Medical Ltd. UK) areadapted for use in patients under general anaesthesia, <strong>and</strong> use a disposable ultrasound transducer positionedmid-oesophagus to generate profiles of blood velocity in the descending aorta. 2 The area under the velocity curveis integrated with respect to time for each heart beat (velocity-time integral or “stroke distance”) <strong>and</strong> then multiplicationby the aortic cross-sectional area gives a measurement of aortic stroke volume. An arbitrary adjustment for theproportion of blood flow that goes to the head <strong>and</strong> upper body is made to get an estimate of cardiac output. Thesemeasurements are automated but the incident angle of the probe relative to the direction of aortic flow is critical<strong>and</strong> must be adjusted to optimize the Doppler spectral envelope, <strong>and</strong> then kept steady.Indices of preload, afterload <strong>and</strong> left ventricular function are obtained by these devices from the shape of thevelocity profile (Figure 3). The width of the velocity envelope is the flow time (corrected for the heart rate) or FTc. Ashorter FTc (less than 350 msec) indicates reduced preload, but in combination with a lower peak velocity indicatesincreased afterload. A low peak velocity <strong>and</strong> flatter upstroke on the velocity profile indicates reduced left ventricularcontractility. Various other factors such as age affect the “normal” values for these indices. The learning curve withthese devices involves some pattern recognition by the user, <strong>and</strong> changes in waveforms in a patient are more easilyCO = Stroke distance x aortic cross-sectional area x HR x corr.CO = cardiac output, HR = heart rate, corr = correction factor for proportion of cardiac output to upper body, limbs<strong>and</strong> head.TRANSTHORACIC BIOIMPEDANCEChanges in electrical impedance in the chest accompany changes in aortic <strong>and</strong> thoracic blood volume with eachheart beat, <strong>and</strong> this principle is used to measure stroke volume <strong>and</strong> cardiac output in these devices, which includethe BioZ (Cardiodynamics, USA) systems. 3 A series of cutaneous electrodes similar to ECG electrodes is used tocollect the signal, <strong>and</strong> SVV can also be measured as in index of preload similar to that provided by the pulse contourtechnique, as well as other indices of left ventricular function. Correct electrode placement is important <strong>and</strong> bodysize <strong>and</strong> other physical factors that impact on electrical conductivity through skin, such as temperature <strong>and</strong> humidityaffect accuracy. Signal changes due to respiration are filtered out.The methodology has been adapted to perioperative use over many years, so that more robust measurementsare obtainable in the presence of electrical interference such as diathermy. Bioreactance is an associated approachwhich uses phase shifts in oscillating current rather than changes in amplitude. Electrical velocimetry (Aesculon,Osypka Medical, Berlin, Germany; ICON, Cardiotronic Inc., La Jolla, CA, USA) incorporates the cyclical change inconductivity that accompanies the change in orientation of erythrocytes that occurs from systole to diastole <strong>and</strong>interprets the maximum rate of change of bioimpedance to calculate cardiac output, <strong>and</strong> may improve on therobustness of measurement.PARTIAL CO 2 REBREATHINGThis is based on the Fick principle applied to CO 2 elimination by the lungs, or more specifically the differential Fickapproach. This measures CO 2 elimination (V Y CO 2) <strong>and</strong> alveolar (end-tidal) CO 2 partial pressure (PE’ CO 2) at two differentlevels of alveolar ventilation to calculate non-shunt pulmonary blood flow non-invasively in ventilated patients. TheNICO (Philips Respironics, USA) uses an automated disposable rebreathing valve <strong>and</strong> loop attached near theY-piece of the breathing circuit to make the change in alveolar ventilation, by altering the serial deadspace in thebreathing system for 45 seconds (Figure 4), which causes a change in CO 2 elimination () accompanied by a 3-4mmHg rise in end-tidal CO 2 partial pressure (∂PE’ CO 2). 4 The unit incorporates a pulse oximeter as well as a gasanalyzer because adjustment needs to be made for unmeasured pulmonary shunt fraction. A similar measurementof cardiac output can be achieved simply altering the respiratory rate <strong>and</strong> I:E ratio delivered by the ventilator, so asto prolong the end-expiratory pause instead of partial rebreathing. 5,6
Cardiac output monitoring in non-cardiac surgery: how <strong>and</strong> why? 183182 <strong>Australasian</strong> <strong>Anaesthesia</strong> <strong>2011</strong>access that the pulmonary artery catheter provides is not given by these less invasive technologies, it is likely thatFluid bolusVasopressor Maintenance fluidthey have comparable performance to thermodilution in measurement of cardiac output. 10,11 & replace lossesFigure 4. The changes in CO 2 variables during partial CO 2 rebreathingThe percentage errors shown by this meta-analysis represent the combined effects of a number of sources oferror of agreement with thermodilution. There are systematic sources of error for some methods, for example, thetendency of thermodilution to overestimate low cardiac output values due to thermal decay during slow right heartBaseline Partialpassage. 13-15 There is inter-patient variability, reflecting a wide variety of sources of error, <strong>and</strong> there is intra-patientvariability.period rebreathingIn general, intra-patient variability is smaller, but most important. Most technologies are able to track changesor trends in cardiac output, at least qualitatively, <strong>and</strong> arguably this is the most important function of a monitor. 16,17A device which gives misleading data on the direction of change of cardiac output may be of more harm thanbenefit in clinical practice. Statistical methods have been discussed recently for assessing “concordance” betweena method <strong>and</strong> thermodilution in measuring changes in cardiac output. 18,19 The ability of devices to track suddenTime –>dramatic changes in cardiac output is hard to study in the clinical setting, <strong>and</strong> relies on animal studies <strong>and</strong> occasionalcase reports of critical events. Some methods, including thermodilution itself, have not performed well in thesereports. 20-22USE IN MANAGEMENT OF PATIENTSA growing number of studies have used these devices to influence patient management during surgery. Most ofthese studies have used the data to guide fluid administration <strong>and</strong> use of vasopressors. A few have included theuse of inotropes to improve cardiac output as well. Where fluid <strong>and</strong> drug administration is guided by specificmeasures of preload, cardiac output or afterload, the term “goal directed” management has been coined.CO = cardiac output, S = solubility coefficient of CO 2 in blood, = change in CO 2 elimination, =Dynamic indices such as SVV appear to be more reliable than static measurements of preload such as centralvenous pressure. 23 Along with systolic pressure <strong>and</strong> pulse pressure variation, 24 SVV appears to be a useful indexof intravascular volume depletion in patients ventilated at tidal volumes of 500 mL or more <strong>and</strong> who are in a regularcardiac rhythm. Kungys et al showed that SVV increase correlated with a reduction in cardiac index <strong>and</strong> transoesophagealechocardiography-based left ventricular end-diastolic volume in patients during acute normovolaemichaemodilution involving removal of 15% of estimated blood volume <strong>and</strong> subsequent replacement with colloid. 25The reliability of PPV or SVV in patients with severe ventricular dysfunction is still unclear, however.For both indices of preload <strong>and</strong> cardiac output measurement, changes in a given patient appear to be moremeaningful than does any isolated value. For this reason, fluid responsiveness has been central to most algorithmsusing these devices to guide management. Increases in stroke volume (SV) <strong>and</strong> cardiac output of 10% or moredecrease in PPV or SVV in response to fluid challenge are considered significant. If preload is judged to be adequateon the basis of a reduced response to fluid administration, hypotension is then treated with vasopressors, (<strong>and</strong> lowcardiac output is treated with inotropes in more aggressive protocols). A simple approach, targeting blood pressure,is given in Figure 5.rise in end-tidal CO 2 partial pressureFigure 5. A simple goal directed haemodynamic strategy targeting blood pressureACCURACY AND PRECISION:All of these technologies have been examined in numerous studies by comparison with other more invasive st<strong>and</strong>ardmethods, most commonly thermodilution. The accuracy (overall bias) <strong>and</strong> precision (scatter of measurement) ofMAP < 80 mmHg ?these methods is generally measured by making simultaneous paired measurements <strong>and</strong> calculating the me<strong>and</strong>ifference (bias) between the measurements by the two methods <strong>and</strong> the st<strong>and</strong>ard deviation of the difference(precision), as described by Bl<strong>and</strong> <strong>and</strong> Altman. 7 95% of measurements lay within 2 st<strong>and</strong>ard deviations either sideof the mean bias, <strong>and</strong> these are called the upper <strong>and</strong> lower limits of agreement. When divided by the mean cardiacoutput in the study, 2 st<strong>and</strong>ard deviations are known as the “percentage error”.The usefulness of this comparison depends on the accuracy <strong>and</strong> precision of thermodilution itself relative tothe true cardiac output. Older studies in the critical care setting which used the oxygen Fick method as the st<strong>and</strong>ardsuggested that the precision of thermodilution was within ± 20% of the true value. 8,9 However newer invasive toolsYesNohave become available, such as indwelling ultrasonic transit time flow probes which can be applied to the aorticSVV > 13% ?root or pulmonary trunk intraoperatively. Animal <strong>and</strong> human studies using these devices show that thermodilutionFTc < 350 msec?has poorer precision than this during haemodynamic instability <strong>and</strong> cardiac surgery <strong>and</strong> that it is not significantlySV |^> 10%?better than that of the less invasive methods outlined above 10,11A meta-analysis of published studies over 10 years combined pooled weighted data collected during surgery<strong>and</strong> critical care <strong>and</strong> showed that these methods all had similar precision of agreement with bolus thermodilution,with percentage errors of between 40-45%. 12 Assuming that thermodilution itself has a similar level of precision,the percentage error of all these methods is likely to be around ± 30% relative to the true cardiac output. This iswider than the acceptable limits recommended by previous authors, 9 but likely to be comparable to the real precisionof thermodilution during cardiac surgery. 10 While much of the direct filling pressure data <strong>and</strong> enhanced vascularYesNo