No quantitative <strong>in</strong>formation on this <strong>in</strong>dicator is available.Debt susta<strong>in</strong>abilityIndicator 8.10: Total number of countries that have reached their HIPC decision po<strong>in</strong>ts andnumber that have reached their HIPC completion po<strong>in</strong>ts (cumulative)This <strong>in</strong>dicator is not relevant to <strong>Bangladesh</strong>.Indicator 8.11: Debt relief committed under HIPC and MDRI InitiativesThis <strong>in</strong>dicator is not relevant to <strong>Bangladesh</strong>.Indicator 8.12: Debt service as a percentage of exports of goods and servicesFor <strong>Bangladesh</strong>, total debt service (TDS) payment <strong>in</strong> 2010-11 was US$ 1,836.6 million(<strong>in</strong>terest: US$ 222.2 million and pr<strong>in</strong>cipal: US$ 1,609.4 million). On the other hand, export ofgoods and services <strong>in</strong> the same year was US$ 37,144.4 million (merchandise export: US$22,924.4 million, services <strong>in</strong>visible receipts: US$ 2,570 million and remittance: US$ 11,650million). Hence, TDS as a proportion of exports of goods and services was 4.94 percent <strong>in</strong>2011. The external debt position of <strong>Bangladesh</strong> is shown <strong>in</strong> Table 9.5.Table 9.5: <strong>Bangladesh</strong>’s External Debt Position, 1990-2011(In US$ million)1990 1995 2000 2005 2010 2011Total outstand<strong>in</strong>g debt 10,609.30 16,766.50 16,210.90 19,285.80 21,448.90 23,608.84Total debt service (TDS) 570.00 552.10 767.20 1,139.50 1,700.70 1,836.60Current account balance (-) 1,579 (-) 1,030 (-) 418 (-) 557 3,734 995Export of goods and services 2,731.0 5,490.0 8,560.0 13,679.5 29,662.7 37,144.4(XGS)GDP at current prices 22,129.3 29,110.6 37,153.6 60,018.3 100,084.0 111,749.0TDS/XGS (%) 20.87 10.06 8.96 8.33 5.73 4.94TDS/GDP (%) 2.58 1.90 2.06 1.90 1.70 1.64Interest/XGS (%) 6.70 2.80 2.20 1.40 0.70 0.60Debt/XGS (%) 388.50 305.40 189.40 141.00 72.30 63.60Debt/GDP (%) 47.90 57.60 43.60 32.10 21.40 22.30Current Account/GDP (%) (-) 7.10 (-) 3.50 (-) 1.10 (-) 0.90 3.70 0.90Source: Flow of External Resources <strong>in</strong>to <strong>Bangladesh</strong> 2011, ERD100
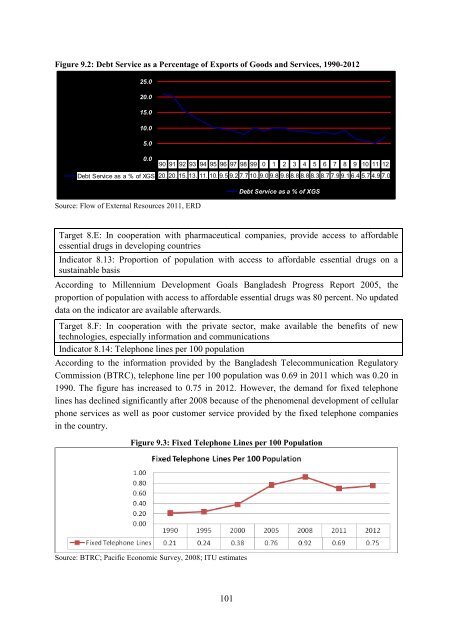
Figure 9.2: Debt Service as a Percentage of Exports of Goods and Services, 1990-<strong>2012</strong>25.020.015.010.05.00.090 91 92 93 94 95 96 97 98 99 0 1 2 3 4 5 6 7 8 9 10 11 12Debt Service as a % of XGS 20. 20. 15. 13. 11. 10. 9.5 9.2 7.7 10. 9.0 9.8 9.8 8.8 8.8 8.3 8.7 7.9 9.1 6.4 5.7 4.9 7.0Debt Service as a % of XGSSource: Flow of External Resources 2011, ERDTarget 8.E: In cooperation with pharmaceutical companies, provide access to affordableessential drugs <strong>in</strong> develop<strong>in</strong>g countriesIndicator 8.13: Proportion of population with access to affordable essential drugs on asusta<strong>in</strong>able basisAccord<strong>in</strong>g to Millennium Development Goals <strong>Bangladesh</strong> Progress <strong>Report</strong> 2005, theproportion of population with access to affordable essential drugs was 80 percent. No updateddata on the <strong>in</strong>dicator are available afterwards.Target 8.F: In cooperation with the private sector, make available the benefits of newtechnologies, especially <strong>in</strong>formation and communicationsIndicator 8.14: Telephone l<strong>in</strong>es per 100 populationAccord<strong>in</strong>g to the <strong>in</strong>formation provided by the <strong>Bangladesh</strong> Telecommunication RegulatoryCommission (BTRC), telephone l<strong>in</strong>e per 100 population was 0.69 <strong>in</strong> 2011 which was 0.20 <strong>in</strong>1990. The figure has <strong>in</strong>creased to 0.75 <strong>in</strong> <strong>2012</strong>. However, the demand for fixed telephonel<strong>in</strong>es has decl<strong>in</strong>ed significantly after 2008 because of the phenomenal development of cellularphone services as well as poor customer service provided by the fixed telephone companies<strong>in</strong> the country.Figure 9.3: Fixed Telephone L<strong>in</strong>es per 100 PopulationSource: BTRC; Pacific Economic Survey, 2008; ITU estimates101
- Page 1 and 2:
The Millennium Development GoalsBan
- Page 3 and 4:
Foreword„Millennium Development G
- Page 5 and 6:
MDG related progress reports/studie
- Page 7 and 8:
List of TablesPage No.Table 2.1: Co
- Page 9:
Figure 5.1: Trends of Under-Five Mo
- Page 12 and 13:
IUCN International Union for Conser
- Page 14 and 15:
Executive SummaryIt is encouraging
- Page 16 and 17:
drowning, have emerged as a conside
- Page 18 and 19:
Chapter 1IntroductionBuilding on th
- Page 20 and 21:
Target 6.C: Have halted by 2015 and
- Page 22 and 23:
Chapter 2Eradicate Extreme Poverty
- Page 24 and 25:
Indicator 1.1a: Proportion of popul
- Page 26 and 27:
In percentThe squared poverty gap,
- Page 28 and 29:
The information relating to growth
- Page 30 and 31:
Indicator 1.6: Proportion of employ
- Page 32 and 33:
There has been some improvement in
- Page 34 and 35:
Figure 2.14: Per Capita per Day Cal
- Page 36 and 37:
livelihood components such as healt
- Page 38 and 39:
Chapter 3Achieve Universal Primary
- Page 40 and 41:
Indicator 2.2: Proportion of pupils
- Page 42 and 43:
environment and learning achievemen
- Page 44 and 45:
For mitigating the hurdles, importa
- Page 46 and 47:
4.1 IntroductionBangladesh has alre
- Page 48 and 49:
double compared with what it was in
- Page 50 and 51: Table 4.1: Participation of Labour
- Page 52 and 53: to narrow the gap through intensive
- Page 54 and 55: Chapter 5Reduce Child MortalityMDG
- Page 56 and 57: the case of rural areas, the under-
- Page 58 and 59: oth sexes. In the case of males, IM
- Page 60 and 61: immunization campaigns, e.g., tetan
- Page 62 and 63: MMR per 100,000 live births6.1 Intr
- Page 64 and 65: %Figure 6.3: Trend of MMR of Bangla
- Page 66 and 67: Survey 2011, on average, women have
- Page 68 and 69: At risk of becoming pregnant, not u
- Page 70 and 71: The life-cycle approach should be u
- Page 72 and 73: Chapter 7Combat HIV/AIDS, Malaria a
- Page 74 and 75: Indicator 6.2: Condom use at last h
- Page 76 and 77: Indicator 6.6b: Death rate associat
- Page 78 and 79: Figure 7.1: DOTS Coverage and Treat
- Page 80 and 81: The coverage of most at risk popula
- Page 82 and 83: Chapter 8Ensure Environmental Susta
- Page 84 and 85: Indicator 7.2: CO 2 emissions, tota
- Page 86 and 87: Target 7.B: Reduce biodiversity los
- Page 88 and 89: systems. Table 8.4 shows the progre
- Page 90 and 91: Table 8.6: Percentage of Urban Popu
- Page 92 and 93: Development and implementation of s
- Page 94 and 95: Goal, targets and indicators (as re
- Page 96 and 97: US$ MillionYearTable 9.1: Trends in
- Page 98 and 99: Table 9.3: ODA Received from the OE
- Page 102 and 103: Indicator 8.15: Cellular subscriber
- Page 104 and 105: Stimulating South-South trade still
- Page 106 and 107: information and strategy on various
- Page 108 and 109: Chapter 10The Journey towards Post-
- Page 110 and 111: intensity of growth, institutional
- Page 112 and 113: Social protection as an instrument
- Page 114 and 115: MDG framework should be on acknowle
- Page 116 and 117: Annexure116
- Page 118 and 119: Goals, targets and indicators (revi
- Page 120 and 121: Goals, targets and indicators (revi
- Page 122 and 123: Annex 2Some macroeconomic indicator
- Page 124 and 125: Annex 3Some tables and figures rela
- Page 126 and 127: Figure 3: Regional comparison of po
- Page 128 and 129: Table 7: International comparison o
- Page 130 and 131: Table 4: Adult literacy rate, 1991-
- Page 132 and 133: Table 5: Proportion of female membe
- Page 134 and 135: Table 3: Infant mortality rate (IMR
- Page 136 and 137: Table 4: Vaccination coverage (meas
- Page 138 and 139: 6. Data related to MDG 6Table 1: In
- Page 140 and 141: Table 2: International comparison o
- Page 142 and 143: Annex 4POST 2015 DEVELOPMENT AGENDA
- Page 144 and 145: 21 January 2013 at the Planning Com
- Page 146 and 147: support from the developed countrie
- Page 148 and 149: TargetsIndicators1.4 Create opportu
- Page 150 and 151:
Targets3.4 Ensure sustainable suppl
- Page 152 and 153:
TargetsIndicatorsdiseases by typeGo
- Page 154 and 155:
Targets7.2 Reduce vulnerability of
- Page 156 and 157:
Goal 9: Promote sustainable product
- Page 158 and 159:
TargetsIndicators Percentage of non
- Page 160:
TargetsIndicators11.7 Strengthen pa