

MDG Report 2012 - United Nations in Bangladesh
MDG Report 2012 - United Nations in Bangladesh
MDG Report 2012 - United Nations in Bangladesh
- No tags were found...

Create successful ePaper yourself
Turn your PDF publications into a flip-book with our unique Google optimized e-Paper software.
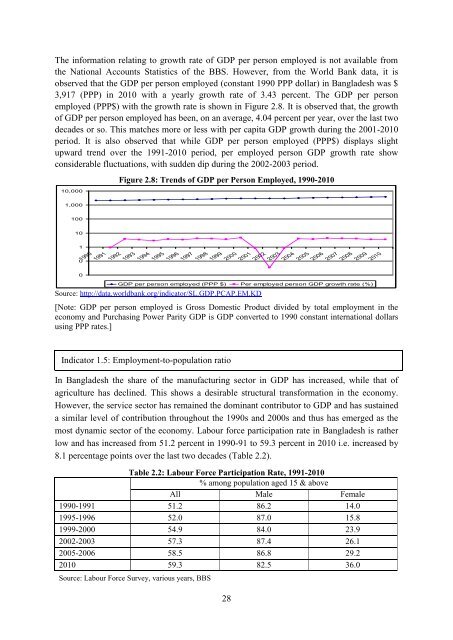
The <strong>in</strong>formation relat<strong>in</strong>g to growth rate of GDP per person employed is not available fromthe National Accounts Statistics of the BBS. However, from the World Bank data, it isobserved that the GDP per person employed (constant 1990 PPP dollar) <strong>in</strong> <strong>Bangladesh</strong> was $3,917 (PPP) <strong>in</strong> 2010 with a yearly growth rate of 3.43 percent. The GDP per personemployed (PPP$) with the growth rate is shown <strong>in</strong> Figure 2.8. It is observed that, the growthof GDP per person employed has been, on an average, 4.04 percent per year, over the last twodecades or so. This matches more or less with per capita GDP growth dur<strong>in</strong>g the 2001-2010period. It is also observed that while GDP per person employed (PPP$) displays slightupward trend over the 1991-2010 period, per employed person GDP growth rate showconsiderable fluctuations, with sudden dip dur<strong>in</strong>g the 2002-2003 period.10,0001,000100101001990Figure 2.8: Trends of GDP per Person Employed, 1990-201019911992199319941995199619971998199920002001200220032004200520062007200820092010GDP per person employed (PPP $) Per employed person GDP growth rate (%)Source: http://data.worldbank.org/<strong>in</strong>dicator/SL.GDP.PCAP.EM.KD[Note: GDP per person employed is Gross Domestic Product divided by total employment <strong>in</strong> theeconomy and Purchas<strong>in</strong>g Power Parity GDP is GDP converted to 1990 constant <strong>in</strong>ternational dollarsus<strong>in</strong>g PPP rates.]Indicator 1.5: Employment-to-population ratioIn <strong>Bangladesh</strong> the share of the manufactur<strong>in</strong>g sector <strong>in</strong> GDP has <strong>in</strong>creased, while that ofagriculture has decl<strong>in</strong>ed. This shows a desirable structural transformation <strong>in</strong> the economy.However, the service sector has rema<strong>in</strong>ed the dom<strong>in</strong>ant contributor to GDP and has susta<strong>in</strong>eda similar level of contribution throughout the 1990s and 2000s and thus has emerged as themost dynamic sector of the economy. Labour force participation rate <strong>in</strong> <strong>Bangladesh</strong> is ratherlow and has <strong>in</strong>creased from 51.2 percent <strong>in</strong> 1990-91 to 59.3 percent <strong>in</strong> 2010 i.e. <strong>in</strong>creased by8.1 percentage po<strong>in</strong>ts over the last two decades (Table 2.2).Table 2.2: Labour Force Participation Rate, 1991-2010% among population aged 15 & aboveAll Male Female1990-1991 51.2 86.2 14.01995-1996 52.0 87.0 15.81999-2000 54.9 84.0 23.92002-2003 57.3 87.4 26.12005-2006 58.5 86.8 29.22010 59.3 82.5 36.0Source: Labour Force Survey, various years, BBS28


