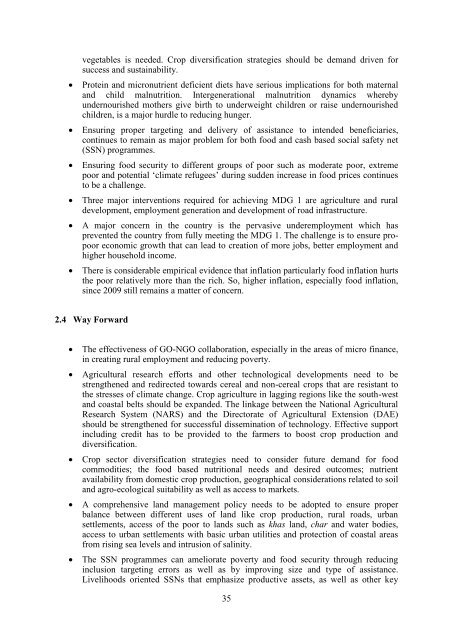
Figure 2.14: Per Capita per Day Calorie Intake (kcal), 1992-2010Per capita per day calorie <strong>in</strong>take (Kcal)240023002200210020001991-92 1995-96 2000 2005 2010Rural 2267.8 2251.1 2263.2 2253.2 2344.6Urban 2258.1 2209.1 2150 2193.8 2244.5National 2266.6 2244 2240.3 2238.5 2318.3Source: HES 1991-92 and HIES, various years, BBSAccord<strong>in</strong>g to the „State of Food Insecurity (SOFI) <strong>2012</strong>‟ jo<strong>in</strong>tly prepared by the FAO, IFADand WFP, <strong>Bangladesh</strong> has halved the prevalence of hunger over the last two decades.However, due to a large population, the absolute number of the hungry people still rema<strong>in</strong>shigh. The report <strong>in</strong>dicates that the proportion of hungry people <strong>in</strong> total population of<strong>Bangladesh</strong> has reduced from 34.6 percent <strong>in</strong> 1990 to 16.8 percent <strong>in</strong> <strong>2012</strong>. The SOFI <strong>2012</strong>,also reports that dur<strong>in</strong>g the same period (1990-<strong>2012</strong>), the number of hungry people <strong>in</strong><strong>Bangladesh</strong> has reduced from 37 million <strong>in</strong> 1990 to 25 million <strong>in</strong> <strong>2012</strong>.Accord<strong>in</strong>g to SOFI <strong>2012</strong>, <strong>Bangladesh</strong> fared well when compared <strong>in</strong> the global and regionalperspective. In 1990, the number of global hungry population was one billion, which nowstands at 868 million, while the number of hungry people <strong>in</strong> South Asia was 325 million <strong>in</strong>the base year, which still rema<strong>in</strong>s as high as 304 million. The prevalence of hunger <strong>in</strong> termsof proportion of total population is 17.6 percent <strong>in</strong> South Asia, which is higher than thehunger prevalence of 16.8 percent <strong>in</strong> <strong>Bangladesh</strong> as mentioned earlier.The Global Hunger Index (GHI) <strong>Report</strong> <strong>2012</strong>, reports that global hunger has decl<strong>in</strong>ed s<strong>in</strong>ce1990 but still rema<strong>in</strong>s at a level characterised as „serious‟. Accord<strong>in</strong>g to the GHI <strong>2012</strong><strong>Report</strong>, <strong>Bangladesh</strong> has improved its rank two steps up <strong>in</strong> the GHI <strong>in</strong> <strong>2012</strong> to 68 th positionfrom 70 th position <strong>in</strong> 2011.2.3 Challenges to Achiev<strong>in</strong>g the TargetsStructural realities and constra<strong>in</strong>ts such as limited land for cultivation, high populationdensity and a grow<strong>in</strong>g population represent significant challenges. To meet the futuredemand of a grow<strong>in</strong>g population, agricultural productivity growth, especially for riceand other crops, need to be susta<strong>in</strong>ed.The lack of diversity <strong>in</strong> <strong>Bangladesh</strong>‟s food crop sector also poses a challenge andmore emphasis on the production of non cereal crops, such as pulses, fruits, and34
vegetables is needed. Crop diversification strategies should be demand driven forsuccess and susta<strong>in</strong>ability.Prote<strong>in</strong> and micronutrient deficient diets have serious implications for both maternaland child malnutrition. Intergenerational malnutrition dynamics wherebyundernourished mothers give birth to underweight children or raise undernourishedchildren, is a major hurdle to reduc<strong>in</strong>g hunger.Ensur<strong>in</strong>g proper target<strong>in</strong>g and delivery of assistance to <strong>in</strong>tended beneficiaries,cont<strong>in</strong>ues to rema<strong>in</strong> as major problem for both food and cash based social safety net(SSN) programmes.Ensur<strong>in</strong>g food security to different groups of poor such as moderate poor, extremepoor and potential „climate refugees‟ dur<strong>in</strong>g sudden <strong>in</strong>crease <strong>in</strong> food prices cont<strong>in</strong>uesto be a challenge.Three major <strong>in</strong>terventions required for achiev<strong>in</strong>g <strong>MDG</strong> 1 are agriculture and ruraldevelopment, employment generation and development of road <strong>in</strong>frastructure.A major concern <strong>in</strong> the country is the pervasive underemployment which hasprevented the country from fully meet<strong>in</strong>g the <strong>MDG</strong> 1. The challenge is to ensure propooreconomic growth that can lead to creation of more jobs, better employment andhigher household <strong>in</strong>come.There is considerable empirical evidence that <strong>in</strong>flation particularly food <strong>in</strong>flation hurtsthe poor relatively more than the rich. So, higher <strong>in</strong>flation, especially food <strong>in</strong>flation,s<strong>in</strong>ce 2009 still rema<strong>in</strong>s a matter of concern.2.4 Way ForwardThe effectiveness of GO-NGO collaboration, especially <strong>in</strong> the areas of micro f<strong>in</strong>ance,<strong>in</strong> creat<strong>in</strong>g rural employment and reduc<strong>in</strong>g poverty.Agricultural research efforts and other technological developments need to bestrengthened and redirected towards cereal and non-cereal crops that are resistant tothe stresses of climate change. Crop agriculture <strong>in</strong> lagg<strong>in</strong>g regions like the south-westand coastal belts should be expanded. The l<strong>in</strong>kage between the National AgriculturalResearch System (NARS) and the Directorate of Agricultural Extension (DAE)should be strengthened for successful dissem<strong>in</strong>ation of technology. Effective support<strong>in</strong>clud<strong>in</strong>g credit has to be provided to the farmers to boost crop production anddiversification.Crop sector diversification strategies need to consider future demand for foodcommodities; the food based nutritional needs and desired outcomes; nutrientavailability from domestic crop production, geographical considerations related to soiland agro-ecological suitability as well as access to markets.A comprehensive land management policy needs to be adopted to ensure properbalance between different uses of land like crop production, rural roads, urbansettlements, access of the poor to lands such as khas land, char and water bodies,access to urban settlements with basic urban utilities and protection of coastal areasfrom ris<strong>in</strong>g sea levels and <strong>in</strong>trusion of sal<strong>in</strong>ity.The SSN programmes can ameliorate poverty and food security through reduc<strong>in</strong>g<strong>in</strong>clusion target<strong>in</strong>g errors as well as by improv<strong>in</strong>g size and type of assistance.Livelihoods oriented SSNs that emphasize productive assets, as well as other key35
- Page 1 and 2: The Millennium Development GoalsBan
- Page 3 and 4: Foreword„Millennium Development G
- Page 5 and 6: MDG related progress reports/studie
- Page 7 and 8: List of TablesPage No.Table 2.1: Co
- Page 9: Figure 5.1: Trends of Under-Five Mo
- Page 12 and 13: IUCN International Union for Conser
- Page 14 and 15: Executive SummaryIt is encouraging
- Page 16 and 17: drowning, have emerged as a conside
- Page 18 and 19: Chapter 1IntroductionBuilding on th
- Page 20 and 21: Target 6.C: Have halted by 2015 and
- Page 22 and 23: Chapter 2Eradicate Extreme Poverty
- Page 24 and 25: Indicator 1.1a: Proportion of popul
- Page 26 and 27: In percentThe squared poverty gap,
- Page 28 and 29: The information relating to growth
- Page 30 and 31: Indicator 1.6: Proportion of employ
- Page 32 and 33: There has been some improvement in
- Page 36 and 37: livelihood components such as healt
- Page 38 and 39: Chapter 3Achieve Universal Primary
- Page 40 and 41: Indicator 2.2: Proportion of pupils
- Page 42 and 43: environment and learning achievemen
- Page 44 and 45: For mitigating the hurdles, importa
- Page 46 and 47: 4.1 IntroductionBangladesh has alre
- Page 48 and 49: double compared with what it was in
- Page 50 and 51: Table 4.1: Participation of Labour
- Page 52 and 53: to narrow the gap through intensive
- Page 54 and 55: Chapter 5Reduce Child MortalityMDG
- Page 56 and 57: the case of rural areas, the under-
- Page 58 and 59: oth sexes. In the case of males, IM
- Page 60 and 61: immunization campaigns, e.g., tetan
- Page 62 and 63: MMR per 100,000 live births6.1 Intr
- Page 64 and 65: %Figure 6.3: Trend of MMR of Bangla
- Page 66 and 67: Survey 2011, on average, women have
- Page 68 and 69: At risk of becoming pregnant, not u
- Page 70 and 71: The life-cycle approach should be u
- Page 72 and 73: Chapter 7Combat HIV/AIDS, Malaria a
- Page 74 and 75: Indicator 6.2: Condom use at last h
- Page 76 and 77: Indicator 6.6b: Death rate associat
- Page 78 and 79: Figure 7.1: DOTS Coverage and Treat
- Page 80 and 81: The coverage of most at risk popula
- Page 82 and 83: Chapter 8Ensure Environmental Susta
- Page 84 and 85:
Indicator 7.2: CO 2 emissions, tota
- Page 86 and 87:
Target 7.B: Reduce biodiversity los
- Page 88 and 89:
systems. Table 8.4 shows the progre
- Page 90 and 91:
Table 8.6: Percentage of Urban Popu
- Page 92 and 93:
Development and implementation of s
- Page 94 and 95:
Goal, targets and indicators (as re
- Page 96 and 97:
US$ MillionYearTable 9.1: Trends in
- Page 98 and 99:
Table 9.3: ODA Received from the OE
- Page 100 and 101:
No quantitative information on this
- Page 102 and 103:
Indicator 8.15: Cellular subscriber
- Page 104 and 105:
Stimulating South-South trade still
- Page 106 and 107:
information and strategy on various
- Page 108 and 109:
Chapter 10The Journey towards Post-
- Page 110 and 111:
intensity of growth, institutional
- Page 112 and 113:
Social protection as an instrument
- Page 114 and 115:
MDG framework should be on acknowle
- Page 116 and 117:
Annexure116
- Page 118 and 119:
Goals, targets and indicators (revi
- Page 120 and 121:
Goals, targets and indicators (revi
- Page 122 and 123:
Annex 2Some macroeconomic indicator
- Page 124 and 125:
Annex 3Some tables and figures rela
- Page 126 and 127:
Figure 3: Regional comparison of po
- Page 128 and 129:
Table 7: International comparison o
- Page 130 and 131:
Table 4: Adult literacy rate, 1991-
- Page 132 and 133:
Table 5: Proportion of female membe
- Page 134 and 135:
Table 3: Infant mortality rate (IMR
- Page 136 and 137:
Table 4: Vaccination coverage (meas
- Page 138 and 139:
6. Data related to MDG 6Table 1: In
- Page 140 and 141:
Table 2: International comparison o
- Page 142 and 143:
Annex 4POST 2015 DEVELOPMENT AGENDA
- Page 144 and 145:
21 January 2013 at the Planning Com
- Page 146 and 147:
support from the developed countrie
- Page 148 and 149:
TargetsIndicators1.4 Create opportu
- Page 150 and 151:
Targets3.4 Ensure sustainable suppl
- Page 152 and 153:
TargetsIndicatorsdiseases by typeGo
- Page 154 and 155:
Targets7.2 Reduce vulnerability of
- Page 156 and 157:
Goal 9: Promote sustainable product
- Page 158 and 159:
TargetsIndicators Percentage of non
- Page 160:
TargetsIndicators11.7 Strengthen pa