Survey 2011, on average, women have 25 percent of their births before reach<strong>in</strong>g twenty yearsof age, 57 percent dur<strong>in</strong>g their twenties, and 17 percent dur<strong>in</strong>g their thirties.Table 6.1: Adolescent Birth Rate, 1975-2011Year Adolescent birth rate Source1975 109 BFS1989 182 BFS1991 179 CPS1993-94 140 BDHS1996-97 147 BDHS1999-00 144 BDHS2004 135 BDHS2007 126 BDHS2011 118 BDHSHowever, accord<strong>in</strong>g to SVRS 2010, the adolescent birth rate has decl<strong>in</strong>ed, from 79 per 1,000women <strong>in</strong> 1990 to 59 <strong>in</strong> 2010 (Figure 6.6). As expected, early childbear<strong>in</strong>g is more common<strong>in</strong> rural areas, among the poor and the less educated. The <strong>Bangladesh</strong> Maternal MortalitySurvey 2010, on the other hand, found adolescent birth rate to be 105 per 1,000 women.Figure 6.6: Adolescent Birth Rate follow<strong>in</strong>g SVRS, 1990-2010Adolescent Birth Rate90807060504030201001990 1995 2000 2005 2010Adolescent Birth Rate 79 55 39 57 59Source: SVRS, various years, BBSIndicator 5.5: Antenatal care coverage (at least one visit and at least four visits)Indicator 5.5a: Antenatal care coverage (at least one visit)Antenatal care from a medically tra<strong>in</strong>ed provider is important to monitor the status of apregnancy and identify the complications associated with the pregnancy. Accord<strong>in</strong>g to BDHS2011, 67.7 percent of women with a birth <strong>in</strong> the three years preced<strong>in</strong>g the survey receivedantenatal care at least once from any provider. Most women (54.6 percent) received care froma medically tra<strong>in</strong>ed provider, e.g., doctor, nurse, midwife, family welfare visitor (FWV),community skilled birth attendant (CSBA), medical assistant (MA), or sub-assistantcommunity medical officer (SACMO).The urban-rural differential <strong>in</strong> antenatal care coverage cont<strong>in</strong>ues to be large: 74.3 percent ofurban women receive antenatal care from a tra<strong>in</strong>ed provider, compared to only 48.7 percentof rural women. Also, regional variation persists. Mothers <strong>in</strong> Khulna are most likely to66
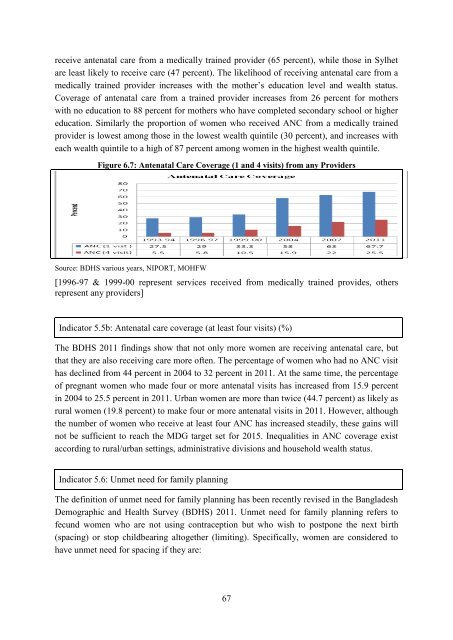
eceive antenatal care from a medically tra<strong>in</strong>ed provider (65 percent), while those <strong>in</strong> Sylhetare least likely to receive care (47 percent). The likelihood of receiv<strong>in</strong>g antenatal care from amedically tra<strong>in</strong>ed provider <strong>in</strong>creases with the mother‟s education level and wealth status.Coverage of antenatal care from a tra<strong>in</strong>ed provider <strong>in</strong>creases from 26 percent for motherswith no education to 88 percent for mothers who have completed secondary school or highereducation. Similarly the proportion of women who received ANC from a medically tra<strong>in</strong>edprovider is lowest among those <strong>in</strong> the lowest wealth qu<strong>in</strong>tile (30 percent), and <strong>in</strong>creases witheach wealth qu<strong>in</strong>tile to a high of 87 percent among women <strong>in</strong> the highest wealth qu<strong>in</strong>tile.Figure 6.7: Antenatal Care Coverage (1 and 4 visits) from any ProvidersSource: BDHS various years, NIPORT, MOHFW[1996-97 & 1999-00 represent services received from medically tra<strong>in</strong>ed provides, othersrepresent any providers]Indicator 5.5b: Antenatal care coverage (at least four visits) (%)The BDHS 2011 f<strong>in</strong>d<strong>in</strong>gs show that not only more women are receiv<strong>in</strong>g antenatal care, butthat they are also receiv<strong>in</strong>g care more often. The percentage of women who had no ANC visithas decl<strong>in</strong>ed from 44 percent <strong>in</strong> 2004 to 32 percent <strong>in</strong> 2011. At the same time, the percentageof pregnant women who made four or more antenatal visits has <strong>in</strong>creased from 15.9 percent<strong>in</strong> 2004 to 25.5 percent <strong>in</strong> 2011. Urban women are more than twice (44.7 percent) as likely asrural women (19.8 percent) to make four or more antenatal visits <strong>in</strong> 2011. However, althoughthe number of women who receive at least four ANC has <strong>in</strong>creased steadily, these ga<strong>in</strong>s willnot be sufficient to reach the <strong>MDG</strong> target set for 2015. Inequalities <strong>in</strong> ANC coverage existaccord<strong>in</strong>g to rural/urban sett<strong>in</strong>gs, adm<strong>in</strong>istrative divisions and household wealth status.Indicator 5.6: Unmet need for family plann<strong>in</strong>gThe def<strong>in</strong>ition of unmet need for family plann<strong>in</strong>g has been recently revised <strong>in</strong> the <strong>Bangladesh</strong>Demographic and Health Survey (BDHS) 2011. Unmet need for family plann<strong>in</strong>g refers tofecund women who are not us<strong>in</strong>g contraception but who wish to postpone the next birth(spac<strong>in</strong>g) or stop childbear<strong>in</strong>g altogether (limit<strong>in</strong>g). Specifically, women are considered tohave unmet need for spac<strong>in</strong>g if they are:67
- Page 1 and 2:
The Millennium Development GoalsBan
- Page 3 and 4:
Foreword„Millennium Development G
- Page 5 and 6:
MDG related progress reports/studie
- Page 7 and 8:
List of TablesPage No.Table 2.1: Co
- Page 9:
Figure 5.1: Trends of Under-Five Mo
- Page 12 and 13:
IUCN International Union for Conser
- Page 14 and 15:
Executive SummaryIt is encouraging
- Page 16 and 17: drowning, have emerged as a conside
- Page 18 and 19: Chapter 1IntroductionBuilding on th
- Page 20 and 21: Target 6.C: Have halted by 2015 and
- Page 22 and 23: Chapter 2Eradicate Extreme Poverty
- Page 24 and 25: Indicator 1.1a: Proportion of popul
- Page 26 and 27: In percentThe squared poverty gap,
- Page 28 and 29: The information relating to growth
- Page 30 and 31: Indicator 1.6: Proportion of employ
- Page 32 and 33: There has been some improvement in
- Page 34 and 35: Figure 2.14: Per Capita per Day Cal
- Page 36 and 37: livelihood components such as healt
- Page 38 and 39: Chapter 3Achieve Universal Primary
- Page 40 and 41: Indicator 2.2: Proportion of pupils
- Page 42 and 43: environment and learning achievemen
- Page 44 and 45: For mitigating the hurdles, importa
- Page 46 and 47: 4.1 IntroductionBangladesh has alre
- Page 48 and 49: double compared with what it was in
- Page 50 and 51: Table 4.1: Participation of Labour
- Page 52 and 53: to narrow the gap through intensive
- Page 54 and 55: Chapter 5Reduce Child MortalityMDG
- Page 56 and 57: the case of rural areas, the under-
- Page 58 and 59: oth sexes. In the case of males, IM
- Page 60 and 61: immunization campaigns, e.g., tetan
- Page 62 and 63: MMR per 100,000 live births6.1 Intr
- Page 64 and 65: %Figure 6.3: Trend of MMR of Bangla
- Page 68 and 69: At risk of becoming pregnant, not u
- Page 70 and 71: The life-cycle approach should be u
- Page 72 and 73: Chapter 7Combat HIV/AIDS, Malaria a
- Page 74 and 75: Indicator 6.2: Condom use at last h
- Page 76 and 77: Indicator 6.6b: Death rate associat
- Page 78 and 79: Figure 7.1: DOTS Coverage and Treat
- Page 80 and 81: The coverage of most at risk popula
- Page 82 and 83: Chapter 8Ensure Environmental Susta
- Page 84 and 85: Indicator 7.2: CO 2 emissions, tota
- Page 86 and 87: Target 7.B: Reduce biodiversity los
- Page 88 and 89: systems. Table 8.4 shows the progre
- Page 90 and 91: Table 8.6: Percentage of Urban Popu
- Page 92 and 93: Development and implementation of s
- Page 94 and 95: Goal, targets and indicators (as re
- Page 96 and 97: US$ MillionYearTable 9.1: Trends in
- Page 98 and 99: Table 9.3: ODA Received from the OE
- Page 100 and 101: No quantitative information on this
- Page 102 and 103: Indicator 8.15: Cellular subscriber
- Page 104 and 105: Stimulating South-South trade still
- Page 106 and 107: information and strategy on various
- Page 108 and 109: Chapter 10The Journey towards Post-
- Page 110 and 111: intensity of growth, institutional
- Page 112 and 113: Social protection as an instrument
- Page 114 and 115: MDG framework should be on acknowle
- Page 116 and 117:
Annexure116
- Page 118 and 119:
Goals, targets and indicators (revi
- Page 120 and 121:
Goals, targets and indicators (revi
- Page 122 and 123:
Annex 2Some macroeconomic indicator
- Page 124 and 125:
Annex 3Some tables and figures rela
- Page 126 and 127:
Figure 3: Regional comparison of po
- Page 128 and 129:
Table 7: International comparison o
- Page 130 and 131:
Table 4: Adult literacy rate, 1991-
- Page 132 and 133:
Table 5: Proportion of female membe
- Page 134 and 135:
Table 3: Infant mortality rate (IMR
- Page 136 and 137:
Table 4: Vaccination coverage (meas
- Page 138 and 139:
6. Data related to MDG 6Table 1: In
- Page 140 and 141:
Table 2: International comparison o
- Page 142 and 143:
Annex 4POST 2015 DEVELOPMENT AGENDA
- Page 144 and 145:
21 January 2013 at the Planning Com
- Page 146 and 147:
support from the developed countrie
- Page 148 and 149:
TargetsIndicators1.4 Create opportu
- Page 150 and 151:
Targets3.4 Ensure sustainable suppl
- Page 152 and 153:
TargetsIndicatorsdiseases by typeGo
- Page 154 and 155:
Targets7.2 Reduce vulnerability of
- Page 156 and 157:
Goal 9: Promote sustainable product
- Page 158 and 159:
TargetsIndicators Percentage of non
- Page 160:
TargetsIndicators11.7 Strengthen pa