US$ MillionYearTable 9.1: Trends <strong>in</strong> ODA Disbursement (<strong>in</strong> million USD), 1991-2011Grant (% of Loan (% of Total Share <strong>in</strong> Per capita disbursementtotal) total) ODA GDP (%)(<strong>in</strong> USD)1990-91 831(48) 901 (52) 1,732 5.60 15.751991-92 817 (51) 794 (49) 1,611 5.15 14.451992-93 818 (49) 857 (51) 1,675 5.23 14.721993-94 710 (46) 849 (54) 1,559 4.61 13.441994-95 890 (51) 849 (49) 1,739 4.59 14.711995-96 677 (47) 766 (53) 1,443 3.55 11.991996-97 736 (50) 745 (50) 1,481 3.5 12.091997-98 503 (40) 748 (60) 1,251 2.85 10.041998-99 669 (44) 867 (56) 1,536 3.37 12.131999-00 726 (46) 862 (54) 1,588 3.37 12.362000-01 504 (37) 865 (63) 1,369 2.92 10.512001-02 479 (33) 963 (67) 1,442 3.04 11.092002-03 510 (32) 1075 (68) 1,585 3.06 12.012003-04 338 (33) 695 (67) 1,033 1.83 7.712004-05 244 (16) 1244 (84) 1,488 2.47 10.952005-06 501 (32) 1067 (68) 1,568 2.54 11.382006-07 590 (36) 1040 (64) 1,630 2.39 11.662007-08 658 (32) 1403 (68) 2,061 2.6 14.532008-09 523 (30) 1204 (70) 1,727 1.94 12.012009-10 639 (29) 1589 (71) 2,228 2.23 15.252010-11 745 (42) 1032 (58) 1,777 1.59 12.01Source: Flow of External Resources <strong>in</strong>to <strong>Bangladesh</strong> 2011, ERDFigure 9.1: Net ODA Received by <strong>Bangladesh</strong> (million US$), 1991-2011Total ODA received2,5002,0001,5001,00050001990-911992-931994-951996-971998-992000-012002-032004-052006-072008-092010-11Source: Flow of External Resources <strong>in</strong>to <strong>Bangladesh</strong> 2011, ERD96
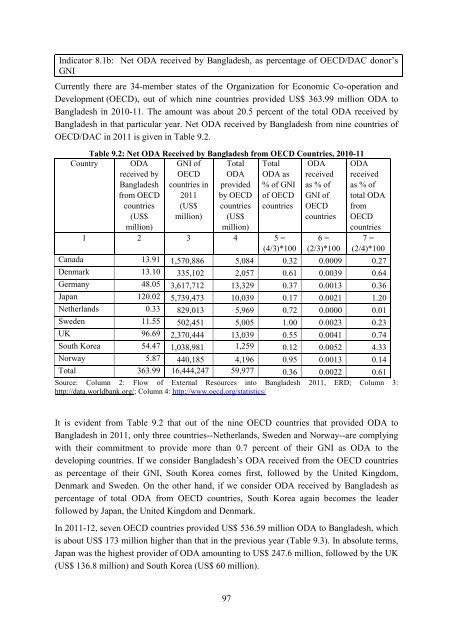
Indicator 8.1b: Net ODA received by <strong>Bangladesh</strong>, as percentage of OECD/DAC donor‟sGNICurrently there are 34-member states of the Organization for Economic Co-operation andDevelopment (OECD), out of which n<strong>in</strong>e countries provided US$ 363.99 million ODA to<strong>Bangladesh</strong> <strong>in</strong> 2010-11. The amount was about 20.5 percent of the total ODA received by<strong>Bangladesh</strong> <strong>in</strong> that particular year. Net ODA received by <strong>Bangladesh</strong> from n<strong>in</strong>e countries ofOECD/DAC <strong>in</strong> 2011 is given <strong>in</strong> Table 9.2.Table 9.2: Net ODA Received by <strong>Bangladesh</strong> from OECD Countries, 2010-11Country ODAreceived by<strong>Bangladesh</strong>from OECDcountries(US$million)GNI ofOECDcountries <strong>in</strong>2011(US$million)TotalODAprovidedby OECDcountries(US$million)TotalODA as% of GNIof OECDcountriesODAreceivedas % ofGNI ofOECDcountriesODAreceivedas % oftotal ODAfromOECDcountries1 2 3 4 5 =(4/3)*1006 =(2/3)*1007 =(2/4)*100Canada 13.91 1,570,886 5,084 0.32 0.0009 0.27Denmark 13.10 335,102 2,057 0.61 0.0039 0.64Germany 48.05 3,617,712 13,329 0.37 0.0013 0.36Japan 120.02 5,739,473 10,039 0.17 0.0021 1.20Netherlands 0.33 829,013 5,969 0.72 0.0000 0.01Sweden 11.55 502,451 5,005 1.00 0.0023 0.23UK 96.69 2,370,444 13,039 0.55 0.0041 0.74South Korea 54.47 1,038,981 1,259 0.12 0.0052 4.33Norway 5.87 440,185 4,196 0.95 0.0013 0.14Total 363.99 16,444,247 59,977 0.36 0.0022 0.61Source: Column 2: Flow of External Resources <strong>in</strong>to <strong>Bangladesh</strong> 2011, ERD; Column 3:http://data.worldbank.org/; Column 4: http://www.oecd.org/statistics/It is evident from Table 9.2 that out of the n<strong>in</strong>e OECD countries that provided ODA to<strong>Bangladesh</strong> <strong>in</strong> 2011, only three countries--Netherlands, Sweden and Norway--are comply<strong>in</strong>gwith their commitment to provide more than 0.7 percent of their GNI as ODA to thedevelop<strong>in</strong>g countries. If we consider <strong>Bangladesh</strong>‟s ODA received from the OECD countriesas percentage of their GNI, South Korea comes first, followed by the <strong>United</strong> K<strong>in</strong>gdom,Denmark and Sweden. On the other hand, if we consider ODA received by <strong>Bangladesh</strong> aspercentage of total ODA from OECD countries, South Korea aga<strong>in</strong> becomes the leaderfollowed by Japan, the <strong>United</strong> K<strong>in</strong>gdom and Denmark.In 2011-12, seven OECD countries provided US$ 536.59 million ODA to <strong>Bangladesh</strong>, whichis about US$ 173 million higher than that <strong>in</strong> the previous year (Table 9.3). In absolute terms,Japan was the highest provider of ODA amount<strong>in</strong>g to US$ 247.6 million, followed by the UK(US$ 136.8 million) and South Korea (US$ 60 million).97
- Page 1 and 2:
The Millennium Development GoalsBan
- Page 3 and 4:
Foreword„Millennium Development G
- Page 5 and 6:
MDG related progress reports/studie
- Page 7 and 8:
List of TablesPage No.Table 2.1: Co
- Page 9:
Figure 5.1: Trends of Under-Five Mo
- Page 12 and 13:
IUCN International Union for Conser
- Page 14 and 15:
Executive SummaryIt is encouraging
- Page 16 and 17:
drowning, have emerged as a conside
- Page 18 and 19:
Chapter 1IntroductionBuilding on th
- Page 20 and 21:
Target 6.C: Have halted by 2015 and
- Page 22 and 23:
Chapter 2Eradicate Extreme Poverty
- Page 24 and 25:
Indicator 1.1a: Proportion of popul
- Page 26 and 27:
In percentThe squared poverty gap,
- Page 28 and 29:
The information relating to growth
- Page 30 and 31:
Indicator 1.6: Proportion of employ
- Page 32 and 33:
There has been some improvement in
- Page 34 and 35:
Figure 2.14: Per Capita per Day Cal
- Page 36 and 37:
livelihood components such as healt
- Page 38 and 39:
Chapter 3Achieve Universal Primary
- Page 40 and 41:
Indicator 2.2: Proportion of pupils
- Page 42 and 43:
environment and learning achievemen
- Page 44 and 45:
For mitigating the hurdles, importa
- Page 46 and 47: 4.1 IntroductionBangladesh has alre
- Page 48 and 49: double compared with what it was in
- Page 50 and 51: Table 4.1: Participation of Labour
- Page 52 and 53: to narrow the gap through intensive
- Page 54 and 55: Chapter 5Reduce Child MortalityMDG
- Page 56 and 57: the case of rural areas, the under-
- Page 58 and 59: oth sexes. In the case of males, IM
- Page 60 and 61: immunization campaigns, e.g., tetan
- Page 62 and 63: MMR per 100,000 live births6.1 Intr
- Page 64 and 65: %Figure 6.3: Trend of MMR of Bangla
- Page 66 and 67: Survey 2011, on average, women have
- Page 68 and 69: At risk of becoming pregnant, not u
- Page 70 and 71: The life-cycle approach should be u
- Page 72 and 73: Chapter 7Combat HIV/AIDS, Malaria a
- Page 74 and 75: Indicator 6.2: Condom use at last h
- Page 76 and 77: Indicator 6.6b: Death rate associat
- Page 78 and 79: Figure 7.1: DOTS Coverage and Treat
- Page 80 and 81: The coverage of most at risk popula
- Page 82 and 83: Chapter 8Ensure Environmental Susta
- Page 84 and 85: Indicator 7.2: CO 2 emissions, tota
- Page 86 and 87: Target 7.B: Reduce biodiversity los
- Page 88 and 89: systems. Table 8.4 shows the progre
- Page 90 and 91: Table 8.6: Percentage of Urban Popu
- Page 92 and 93: Development and implementation of s
- Page 94 and 95: Goal, targets and indicators (as re
- Page 98 and 99: Table 9.3: ODA Received from the OE
- Page 100 and 101: No quantitative information on this
- Page 102 and 103: Indicator 8.15: Cellular subscriber
- Page 104 and 105: Stimulating South-South trade still
- Page 106 and 107: information and strategy on various
- Page 108 and 109: Chapter 10The Journey towards Post-
- Page 110 and 111: intensity of growth, institutional
- Page 112 and 113: Social protection as an instrument
- Page 114 and 115: MDG framework should be on acknowle
- Page 116 and 117: Annexure116
- Page 118 and 119: Goals, targets and indicators (revi
- Page 120 and 121: Goals, targets and indicators (revi
- Page 122 and 123: Annex 2Some macroeconomic indicator
- Page 124 and 125: Annex 3Some tables and figures rela
- Page 126 and 127: Figure 3: Regional comparison of po
- Page 128 and 129: Table 7: International comparison o
- Page 130 and 131: Table 4: Adult literacy rate, 1991-
- Page 132 and 133: Table 5: Proportion of female membe
- Page 134 and 135: Table 3: Infant mortality rate (IMR
- Page 136 and 137: Table 4: Vaccination coverage (meas
- Page 138 and 139: 6. Data related to MDG 6Table 1: In
- Page 140 and 141: Table 2: International comparison o
- Page 142 and 143: Annex 4POST 2015 DEVELOPMENT AGENDA
- Page 144 and 145: 21 January 2013 at the Planning Com
- Page 146 and 147:
support from the developed countrie
- Page 148 and 149:
TargetsIndicators1.4 Create opportu
- Page 150 and 151:
Targets3.4 Ensure sustainable suppl
- Page 152 and 153:
TargetsIndicatorsdiseases by typeGo
- Page 154 and 155:
Targets7.2 Reduce vulnerability of
- Page 156 and 157:
Goal 9: Promote sustainable product
- Page 158 and 159:
TargetsIndicators Percentage of non
- Page 160:
TargetsIndicators11.7 Strengthen pa