MDG Report 2012 - United Nations in Bangladesh
MDG Report 2012 - United Nations in Bangladesh
MDG Report 2012 - United Nations in Bangladesh
- No tags were found...
You also want an ePaper? Increase the reach of your titles
YUMPU automatically turns print PDFs into web optimized ePapers that Google loves.
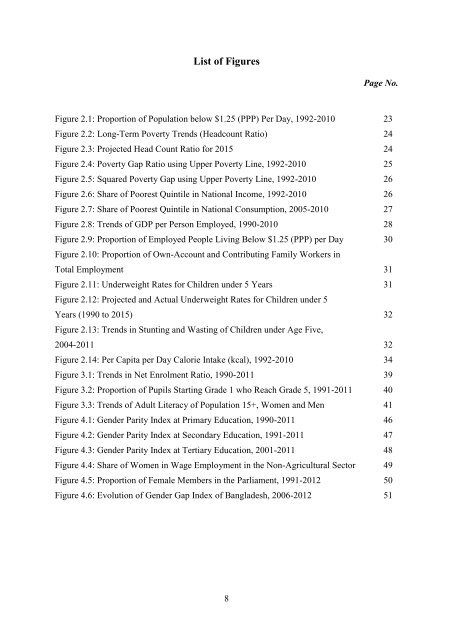
List of FiguresPage No.Figure 2.1: Proportion of Population below $1.25 (PPP) Per Day, 1992-2010 23Figure 2.2: Long-Term Poverty Trends (Headcount Ratio) 24Figure 2.3: Projected Head Count Ratio for 2015 24Figure 2.4: Poverty Gap Ratio us<strong>in</strong>g Upper Poverty L<strong>in</strong>e, 1992-2010 25Figure 2.5: Squared Poverty Gap us<strong>in</strong>g Upper Poverty L<strong>in</strong>e, 1992-2010 26Figure 2.6: Share of Poorest Qu<strong>in</strong>tile <strong>in</strong> National Income, 1992-2010 26Figure 2.7: Share of Poorest Qu<strong>in</strong>tile <strong>in</strong> National Consumption, 2005-2010 27Figure 2.8: Trends of GDP per Person Employed, 1990-2010 28Figure 2.9: Proportion of Employed People Liv<strong>in</strong>g Below $1.25 (PPP) per Day 30Figure 2.10: Proportion of Own-Account and Contribut<strong>in</strong>g Family Workers <strong>in</strong>Total Employment 31Figure 2.11: Underweight Rates for Children under 5 Years 31Figure 2.12: Projected and Actual Underweight Rates for Children under 5Years (1990 to 2015) 32Figure 2.13: Trends <strong>in</strong> Stunt<strong>in</strong>g and Wast<strong>in</strong>g of Children under Age Five,2004-2011 32Figure 2.14: Per Capita per Day Calorie Intake (kcal), 1992-2010 34Figure 3.1: Trends <strong>in</strong> Net Enrolment Ratio, 1990-2011 39Figure 3.2: Proportion of Pupils Start<strong>in</strong>g Grade 1 who Reach Grade 5, 1991-2011 40Figure 3.3: Trends of Adult Literacy of Population 15+, Women and Men 41Figure 4.1: Gender Parity Index at Primary Education, 1990-2011 46Figure 4.2: Gender Parity Index at Secondary Education, 1991-2011 47Figure 4.3: Gender Parity Index at Tertiary Education, 2001-2011 48Figure 4.4: Share of Women <strong>in</strong> Wage Employment <strong>in</strong> the Non-Agricultural Sector 49Figure 4.5: Proportion of Female Members <strong>in</strong> the Parliament, 1991-<strong>2012</strong> 50Figure 4.6: Evolution of Gender Gap Index of <strong>Bangladesh</strong>, 2006-<strong>2012</strong> 518


