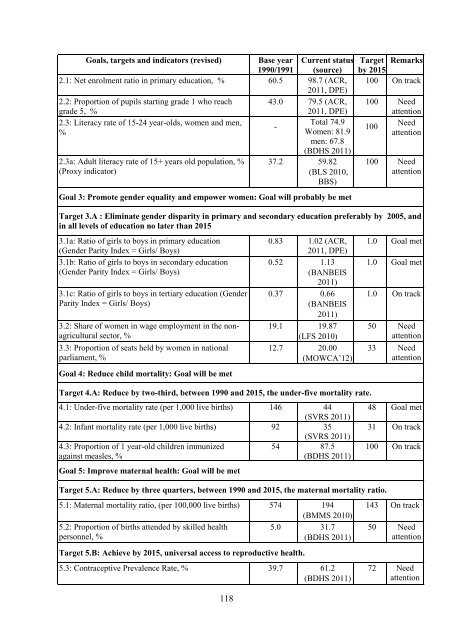
Goals, targets and <strong>in</strong>dicators (revised) Base year1990/1991Current status(source)2.1: Net enrolment ratio <strong>in</strong> primary education, % 60.5 98.7 (ACR,2011, DPE)2.2: Proportion of pupils start<strong>in</strong>g grade 1 who reach 43.0 79.5 (ACR,grade 5, %2011, DPE)2.3: Literacy rate of 15-24 year-olds, women and men,%-2.3a: Adult literacy rate of 15+ years old population, %(Proxy <strong>in</strong>dicator)Total 74.9Women: 81.9men: 67.8(BDHS 2011)37.2 59.82(BLS 2010,BBS)Goal 3: Promote gender equality and empower women: Goal will probably be metTarget Remarksby 2015100 On track100 Needattention100Needattention100 NeedattentionTarget 3.A : Elim<strong>in</strong>ate gender disparity <strong>in</strong> primary and secondary education preferably by 2005, and<strong>in</strong> all levels of education no later than 20153.1a: Ratio of girls to boys <strong>in</strong> primary education(Gender Parity Index = Girls/ Boys)3.1b: Ratio of girls to boys <strong>in</strong> secondary education(Gender Parity Index = Girls/ Boys)3.1c: Ratio of girls to boys <strong>in</strong> tertiary education (GenderParity Index = Girls/ Boys)3.2: Share of women <strong>in</strong> wage employment <strong>in</strong> the nonagriculturalsector, %3.3: Proportion of seats held by women <strong>in</strong> nationalparliament, %Goal 4: Reduce child mortality: Goal will be met1180.83 1.02 (ACR,2011, DPE)0.52 1.13(BANBEIS2011)0.37 0.66(BANBEIS2011)19.1 19.87(LFS 2010)12.7 20.00(MOWCA‟12)Target 4.A: Reduce by two-third, between 1990 and 2015, the under-five mortality rate.4.1: Under-five mortality rate (per 1,000 live births) 146 44(SVRS 2011)4.2: Infant mortality rate (per 1,000 live births) 92 35(SVRS 2011)4.3: Proportion of 1 year-old children immunized54 87.5aga<strong>in</strong>st measles, %(BDHS 2011)Goal 5: Improve maternal health: Goal will be metTarget 5.A: Reduce by three quarters, between 1990 and 2015, the maternal mortality ratio.5.1: Maternal mortality ratio, (per 100,000 live births) 574 194(BMMS 2010)5.2: Proportion of births attended by skilled health5.0 31.7personnel, %(BDHS 2011)Target 5.B: Achieve by 2015, universal access to reproductive health.5.3: Contraceptive Prevalence Rate, % 39.7 61.2(BDHS 2011)1.0 Goal met1.0 Goal met1.0 On track50 Needattention33 Needattention48 Goal met31 On track100 On track143 On track50 Needattention72 Needattention
Goals, targets and <strong>in</strong>dicators (revised) Base year1990/1991Current status(source)5.4: Adolescent birth rate, (per 1,000 women) 77 118.3(BDHS 2011)5.5a: Antenatal care coverage (at least one visit), % 27.5 67.7(1993-94) (BDHS 2011)5.5b: Antenatal care coverage (at least four visits), % 5.5 25.5(1993-94) (BDHS 2011)5.6: Unmet need for family plann<strong>in</strong>g, % 21.6 13.5(1993-94) (BDHS 2011)Goal 6: Combat HIV/AIDS, malaria and other diseasesTarget Remarksby 2015- -100 Needattention50 Needattention7.6 NeedattentionTarget 6.A: Have halted by 2015 and begun to reverse the spread of HIV/AIDS6.1: HIV prevalence among population, % 0.005 0.1 Halt<strong>in</strong>g On track(9th SS, 2011)6.2: Condom use rate at last high risk sex, % 6.3 44-67 - -(UNGASS 2010)6.3: Proportion of population aged 15-24 years with - 17.7 - -comprehensive correct knowledge of HIV/AIDS, %(NASP, 2009)6.4: Ratio of school attendance of orphans to schoolattendance of non-orphans aged 10-14 yearsLack of dataTarget 6.B: Achieve, by 2010, universal access to treatment for HIV/AIDS for all those who need it6.5: Proportion of population with advanced HIV<strong>in</strong>fection with access to antiretroviral drugs, %- 100 (NASP<strong>2012</strong>)100 Goal metTarget 6.C: Have halted by 2015 and begun to reverse the <strong>in</strong>cidence of malaria and other majordiseases6.6a: Prevalence of malaria per 100,000 population 776.9(2008)6.6b: Deaths of malaria per 100,000 population 1.4(2008)6.7: Proportion of children under-5 sleep<strong>in</strong>g under81<strong>in</strong>secticide treated bed nets (13 high risk malaria(2008)districts), %6.8: Proportion of children under 5 with fever who aretreated with appropriate anti malarial drugs, %60(2008)270.84(MIS NMCP<strong>2012</strong>)0.101 (MISNMCP <strong>2012</strong>)94.40 (MIS,NMCP <strong>2012</strong>)89.30(MIS NMCP2011)6.9a: Prevalence of TB per 100,000 population 493 411(GTBR 2011)6.9b: Deaths of TB per 100,000 population 58 43(GTBR 2011)6.10a: Detection rate of TB under DOTS, % 21 70 (MIS, NTP,(1994) DGHS 2011)6.10b: Cure rate of TB under DOTS, % 73(1994)92(MIS, NTP2011)310.8 Needattention0.6 On track90 Goal met90 On track320 On track38 On track70 Goal met>85 Goal met119
- Page 1 and 2:
The Millennium Development GoalsBan
- Page 3 and 4:
Foreword„Millennium Development G
- Page 5 and 6:
MDG related progress reports/studie
- Page 7 and 8:
List of TablesPage No.Table 2.1: Co
- Page 9:
Figure 5.1: Trends of Under-Five Mo
- Page 12 and 13:
IUCN International Union for Conser
- Page 14 and 15:
Executive SummaryIt is encouraging
- Page 16 and 17:
drowning, have emerged as a conside
- Page 18 and 19:
Chapter 1IntroductionBuilding on th
- Page 20 and 21:
Target 6.C: Have halted by 2015 and
- Page 22 and 23:
Chapter 2Eradicate Extreme Poverty
- Page 24 and 25:
Indicator 1.1a: Proportion of popul
- Page 26 and 27:
In percentThe squared poverty gap,
- Page 28 and 29:
The information relating to growth
- Page 30 and 31:
Indicator 1.6: Proportion of employ
- Page 32 and 33:
There has been some improvement in
- Page 34 and 35:
Figure 2.14: Per Capita per Day Cal
- Page 36 and 37:
livelihood components such as healt
- Page 38 and 39:
Chapter 3Achieve Universal Primary
- Page 40 and 41:
Indicator 2.2: Proportion of pupils
- Page 42 and 43:
environment and learning achievemen
- Page 44 and 45:
For mitigating the hurdles, importa
- Page 46 and 47:
4.1 IntroductionBangladesh has alre
- Page 48 and 49:
double compared with what it was in
- Page 50 and 51:
Table 4.1: Participation of Labour
- Page 52 and 53:
to narrow the gap through intensive
- Page 54 and 55:
Chapter 5Reduce Child MortalityMDG
- Page 56 and 57:
the case of rural areas, the under-
- Page 58 and 59:
oth sexes. In the case of males, IM
- Page 60 and 61:
immunization campaigns, e.g., tetan
- Page 62 and 63:
MMR per 100,000 live births6.1 Intr
- Page 64 and 65:
%Figure 6.3: Trend of MMR of Bangla
- Page 66 and 67:
Survey 2011, on average, women have
- Page 68 and 69: At risk of becoming pregnant, not u
- Page 70 and 71: The life-cycle approach should be u
- Page 72 and 73: Chapter 7Combat HIV/AIDS, Malaria a
- Page 74 and 75: Indicator 6.2: Condom use at last h
- Page 76 and 77: Indicator 6.6b: Death rate associat
- Page 78 and 79: Figure 7.1: DOTS Coverage and Treat
- Page 80 and 81: The coverage of most at risk popula
- Page 82 and 83: Chapter 8Ensure Environmental Susta
- Page 84 and 85: Indicator 7.2: CO 2 emissions, tota
- Page 86 and 87: Target 7.B: Reduce biodiversity los
- Page 88 and 89: systems. Table 8.4 shows the progre
- Page 90 and 91: Table 8.6: Percentage of Urban Popu
- Page 92 and 93: Development and implementation of s
- Page 94 and 95: Goal, targets and indicators (as re
- Page 96 and 97: US$ MillionYearTable 9.1: Trends in
- Page 98 and 99: Table 9.3: ODA Received from the OE
- Page 100 and 101: No quantitative information on this
- Page 102 and 103: Indicator 8.15: Cellular subscriber
- Page 104 and 105: Stimulating South-South trade still
- Page 106 and 107: information and strategy on various
- Page 108 and 109: Chapter 10The Journey towards Post-
- Page 110 and 111: intensity of growth, institutional
- Page 112 and 113: Social protection as an instrument
- Page 114 and 115: MDG framework should be on acknowle
- Page 116 and 117: Annexure116
- Page 120 and 121: Goals, targets and indicators (revi
- Page 122 and 123: Annex 2Some macroeconomic indicator
- Page 124 and 125: Annex 3Some tables and figures rela
- Page 126 and 127: Figure 3: Regional comparison of po
- Page 128 and 129: Table 7: International comparison o
- Page 130 and 131: Table 4: Adult literacy rate, 1991-
- Page 132 and 133: Table 5: Proportion of female membe
- Page 134 and 135: Table 3: Infant mortality rate (IMR
- Page 136 and 137: Table 4: Vaccination coverage (meas
- Page 138 and 139: 6. Data related to MDG 6Table 1: In
- Page 140 and 141: Table 2: International comparison o
- Page 142 and 143: Annex 4POST 2015 DEVELOPMENT AGENDA
- Page 144 and 145: 21 January 2013 at the Planning Com
- Page 146 and 147: support from the developed countrie
- Page 148 and 149: TargetsIndicators1.4 Create opportu
- Page 150 and 151: Targets3.4 Ensure sustainable suppl
- Page 152 and 153: TargetsIndicatorsdiseases by typeGo
- Page 154 and 155: Targets7.2 Reduce vulnerability of
- Page 156 and 157: Goal 9: Promote sustainable product
- Page 158 and 159: TargetsIndicators Percentage of non
- Page 160: TargetsIndicators11.7 Strengthen pa