

MDG Report 2012 - United Nations in Bangladesh
MDG Report 2012 - United Nations in Bangladesh
MDG Report 2012 - United Nations in Bangladesh
- No tags were found...

You also want an ePaper? Increase the reach of your titles
YUMPU automatically turns print PDFs into web optimized ePapers that Google loves.
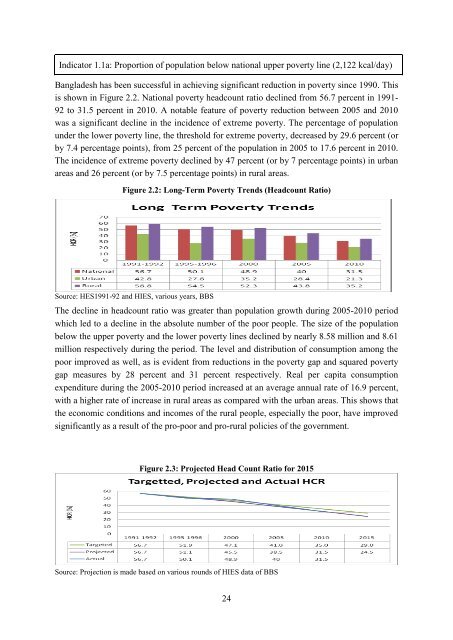
Indicator 1.1a: Proportion of population below national upper poverty l<strong>in</strong>e (2,122 kcal/day)<strong>Bangladesh</strong> has been successful <strong>in</strong> achiev<strong>in</strong>g significant reduction <strong>in</strong> poverty s<strong>in</strong>ce 1990. Thisis shown <strong>in</strong> Figure 2.2. National poverty headcount ratio decl<strong>in</strong>ed from 56.7 percent <strong>in</strong> 1991-92 to 31.5 percent <strong>in</strong> 2010. A notable feature of poverty reduction between 2005 and 2010was a significant decl<strong>in</strong>e <strong>in</strong> the <strong>in</strong>cidence of extreme poverty. The percentage of populationunder the lower poverty l<strong>in</strong>e, the threshold for extreme poverty, decreased by 29.6 percent (orby 7.4 percentage po<strong>in</strong>ts), from 25 percent of the population <strong>in</strong> 2005 to 17.6 percent <strong>in</strong> 2010.The <strong>in</strong>cidence of extreme poverty decl<strong>in</strong>ed by 47 percent (or by 7 percentage po<strong>in</strong>ts) <strong>in</strong> urbanareas and 26 percent (or by 7.5 percentage po<strong>in</strong>ts) <strong>in</strong> rural areas.Figure 2.2: Long-Term Poverty Trends (Headcount Ratio)Source: HES1991-92 and HIES, various years, BBSThe decl<strong>in</strong>e <strong>in</strong> headcount ratio was greater than population growth dur<strong>in</strong>g 2005-2010 periodwhich led to a decl<strong>in</strong>e <strong>in</strong> the absolute number of the poor people. The size of the populationbelow the upper poverty and the lower poverty l<strong>in</strong>es decl<strong>in</strong>ed by nearly 8.58 million and 8.61million respectively dur<strong>in</strong>g the period. The level and distribution of consumption among thepoor improved as well, as is evident from reductions <strong>in</strong> the poverty gap and squared povertygap measures by 28 percent and 31 percent respectively. Real per capita consumptionexpenditure dur<strong>in</strong>g the 2005-2010 period <strong>in</strong>creased at an average annual rate of 16.9 percent,with a higher rate of <strong>in</strong>crease <strong>in</strong> rural areas as compared with the urban areas. This shows thatthe economic conditions and <strong>in</strong>comes of the rural people, especially the poor, have improvedsignificantly as a result of the pro-poor and pro-rural policies of the government.Figure 2.3: Projected Head Count Ratio for 2015Source: Projection is made based on various rounds of HIES data of BBS24


