Measurement of the Jet Energy Scale in the CMS experiment ... - IIHE
Measurement of the Jet Energy Scale in the CMS experiment ... - IIHE
Measurement of the Jet Energy Scale in the CMS experiment ... - IIHE

Create successful ePaper yourself
Turn your PDF publications into a flip-book with our unique Google optimized e-Paper software.
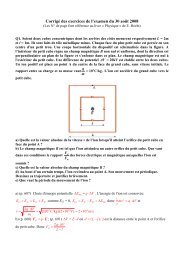
CHAPTER 5: Estimat<strong>in</strong>g <strong>of</strong> <strong>the</strong> <strong>Jet</strong> <strong>Energy</strong> <strong>Scale</strong> Calibration Factor 107(%)est∆ε l-2-4(%)est∆ε b42-60-8-2-10-4-12-14-18 -16 -14 -12 -10 -8 -6 -4 -2 0 2 exp∆ε l (%)-6-8-10 -5 0 5 10 exp∆ε b (%)Figure 5.21: The calibration curves represent<strong>in</strong>g <strong>the</strong> estimated residual jet energycorrections as a function <strong>of</strong> <strong>the</strong> expected jet energy corrections when apply<strong>in</strong>g several<strong>in</strong>clusive shifts on <strong>the</strong> <strong>in</strong>put energy <strong>of</strong> <strong>the</strong> reconstructed jets. A l<strong>in</strong>e with a unity slopeis overimposed for comparison.<strong>in</strong> a calibration curve with a non-unity slope. This can be fixed as expla<strong>in</strong>ed below.The non-unity slope <strong>of</strong> <strong>the</strong> calibration curves can be solved by <strong>the</strong> use <strong>of</strong> successiveiterations, which means <strong>the</strong> estimated jet energy corrections found <strong>in</strong> a first iterationare applied on <strong>the</strong> <strong>in</strong>itial jet energy scales. In a second iteration, <strong>the</strong> residual jet energycorrections can aga<strong>in</strong> be estimated, start<strong>in</strong>g with <strong>the</strong> corrected jets <strong>of</strong> <strong>the</strong> first iteration.Ideally, <strong>in</strong> a second iteration no residual jet energy correction should be needed, giventhat <strong>the</strong> estimated jet energy correction is equal to <strong>the</strong> expected jet energy correction<strong>in</strong> <strong>the</strong> first iteration. O<strong>the</strong>wise, <strong>the</strong> iteration procedure should be repeated until aresidual jet energy correction equals to zero is estimated. This means after apply<strong>in</strong>gseveral iterations, <strong>the</strong> estimation converges to <strong>the</strong> l<strong>in</strong>e ∆ε estl,b = ∆εexp l,b, means <strong>the</strong> slop<strong>of</strong> <strong>the</strong> calibration curve becomes close to <strong>the</strong> unity.5.5.2 Pull DistributionIn order to evaluate if <strong>the</strong> statistical uncerta<strong>in</strong>ties on <strong>the</strong> estimators have been quotedcorrectly, one can start look<strong>in</strong>g at <strong>the</strong> pull distributions which are def<strong>in</strong>ed as(∆ε i l,b − < ∆ε l,b >),δ∆ε i l,bwhere ∆ε l,b and δ∆ε l,b , as already used, are <strong>the</strong> estimated residual jet energy correctionsand <strong>the</strong>ir statistical errors, respectively. The <strong>in</strong>dex i is expla<strong>in</strong>ed as follows.The <strong>in</strong>itial simulated e+jets t¯t sample conta<strong>in</strong>s about 180000 events. In an analysiscorrespond<strong>in</strong>g to 100pb −1 , one would expect to obta<strong>in</strong> 2333 signal events, as it canbe deduced from <strong>the</strong> cross section <strong>of</strong> <strong>the</strong> e+jets t¯t process. Hence <strong>in</strong>stead <strong>of</strong> giv<strong>in</strong>g aweight to <strong>the</strong> <strong>in</strong>itial simulated events, one can repeat <strong>the</strong> whole analysis on <strong>the</strong> smallerbulks <strong>of</strong> simulated events, so-called pseudo-<strong>experiment</strong>s, where each conta<strong>in</strong> 2333 signalevents. Therefore, start<strong>in</strong>g with <strong>the</strong> <strong>in</strong>itial number <strong>of</strong> simulated signal events, onewould end with about 77 uncorrelated pseudo-<strong>experiment</strong>s. Here no correlation meansthat a s<strong>in</strong>gle signal event is not processed <strong>in</strong> no more than one pseudo-<strong>experiment</strong>.