Measurement of the Jet Energy Scale in the CMS experiment ... - IIHE
Measurement of the Jet Energy Scale in the CMS experiment ... - IIHE
Measurement of the Jet Energy Scale in the CMS experiment ... - IIHE

You also want an ePaper? Increase the reach of your titles
YUMPU automatically turns print PDFs into web optimized ePapers that Google loves.
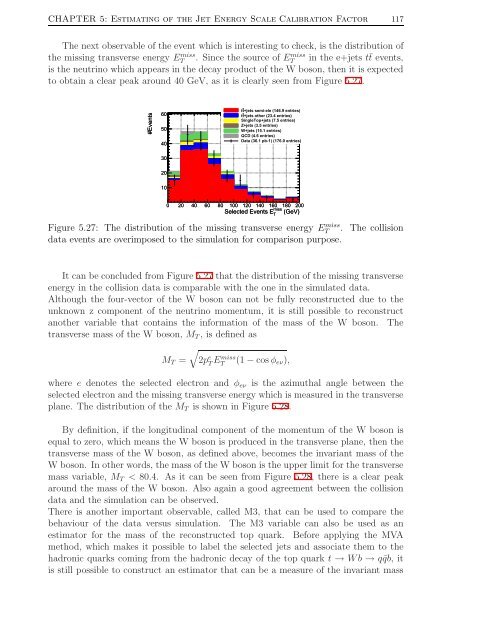
CHAPTER 5: Estimat<strong>in</strong>g <strong>of</strong> <strong>the</strong> <strong>Jet</strong> <strong>Energy</strong> <strong>Scale</strong> Calibration Factor 117The next observable <strong>of</strong> <strong>the</strong> event which is <strong>in</strong>terest<strong>in</strong>g to check, is <strong>the</strong> distribution <strong>of</strong><strong>the</strong> miss<strong>in</strong>g transverse energy ETmiss . S<strong>in</strong>ce <strong>the</strong> source <strong>of</strong> ETmiss <strong>in</strong> <strong>the</strong> e+jets t¯t events,is <strong>the</strong> neutr<strong>in</strong>o which appears <strong>in</strong> <strong>the</strong> decay product <strong>of</strong> <strong>the</strong> W boson, <strong>the</strong>n it is expectedto obta<strong>in</strong> a clear peak around 40 GeV, as it is clearly seen from Figure 5.27.#Events605040tt+jets semi-ele (146.9 entries)tt+jets o<strong>the</strong>r (23.4 entries)S<strong>in</strong>gleTop+jets (7.5 entries)Z+jets (3.5 entries)W+jets (15.1 entries)QCD (4.6 entries)Data (36.1 pb-1) (176.0 entries)3020100 20 40 60 80 100 120 140 160 180 200missSelected Events E T(GeV)Figure 5.27: The distribution <strong>of</strong> <strong>the</strong> miss<strong>in</strong>g transverse energy ETmiss . The collisiondata events are overimposed to <strong>the</strong> simulation for comparison purpose.It can be concluded from Figure 5.27 that <strong>the</strong> distribution <strong>of</strong> <strong>the</strong> miss<strong>in</strong>g transverseenergy <strong>in</strong> <strong>the</strong> collision data is comparable with <strong>the</strong> one <strong>in</strong> <strong>the</strong> simulated data.Although <strong>the</strong> four-vector <strong>of</strong> <strong>the</strong> W boson can not be fully reconstructed due to <strong>the</strong>unknown z component <strong>of</strong> <strong>the</strong> neutr<strong>in</strong>o momentum, it is still possible to reconstructano<strong>the</strong>r variable that conta<strong>in</strong>s <strong>the</strong> <strong>in</strong>formation <strong>of</strong> <strong>the</strong> mass <strong>of</strong> <strong>the</strong> W boson. Thetransverse mass <strong>of</strong> <strong>the</strong> W boson, M T , is def<strong>in</strong>ed as√M T = 2p e T Emiss T(1 − cos φ eν ),where e denotes <strong>the</strong> selected electron and φ eν is <strong>the</strong> azimuthal angle between <strong>the</strong>selected electron and <strong>the</strong> miss<strong>in</strong>g transverse energy which is measured <strong>in</strong> <strong>the</strong> transverseplane. The distribution <strong>of</strong> <strong>the</strong> M T is shown <strong>in</strong> Figure 5.28.By def<strong>in</strong>ition, if <strong>the</strong> longitud<strong>in</strong>al component <strong>of</strong> <strong>the</strong> momentum <strong>of</strong> <strong>the</strong> W boson isequal to zero, which means <strong>the</strong> W boson is produced <strong>in</strong> <strong>the</strong> transverse plane, <strong>the</strong>n <strong>the</strong>transverse mass <strong>of</strong> <strong>the</strong> W boson, as def<strong>in</strong>ed above, becomes <strong>the</strong> <strong>in</strong>variant mass <strong>of</strong> <strong>the</strong>W boson. In o<strong>the</strong>r words, <strong>the</strong> mass <strong>of</strong> <strong>the</strong> W boson is <strong>the</strong> upper limit for <strong>the</strong> transversemass variable, M T < 80.4. As it can be seen from Figure 5.28, <strong>the</strong>re is a clear peakaround <strong>the</strong> mass <strong>of</strong> <strong>the</strong> W boson. Also aga<strong>in</strong> a good agreement between <strong>the</strong> collisiondata and <strong>the</strong> simulation can be observed.There is ano<strong>the</strong>r important observable, called M3, that can be used to compare <strong>the</strong>behaviour <strong>of</strong> <strong>the</strong> data versus simulation. The M3 variable can also be used as anestimator for <strong>the</strong> mass <strong>of</strong> <strong>the</strong> reconstructed top quark. Before apply<strong>in</strong>g <strong>the</strong> MVAmethod, which makes it possible to label <strong>the</strong> selected jets and associate <strong>the</strong>m to <strong>the</strong>hadronic quarks com<strong>in</strong>g from <strong>the</strong> hadronic decay <strong>of</strong> <strong>the</strong> top quark t → Wb → q¯qb, itis still possible to construct an estimator that can be a measure <strong>of</strong> <strong>the</strong> <strong>in</strong>variant mass