Measurement of the Jet Energy Scale in the CMS experiment ... - IIHE
Measurement of the Jet Energy Scale in the CMS experiment ... - IIHE
Measurement of the Jet Energy Scale in the CMS experiment ... - IIHE

You also want an ePaper? Increase the reach of your titles
YUMPU automatically turns print PDFs into web optimized ePapers that Google loves.
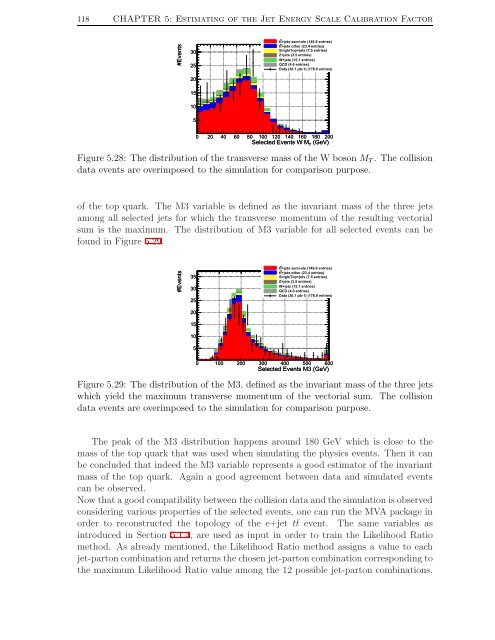
118 CHAPTER 5: Estimat<strong>in</strong>g <strong>of</strong> <strong>the</strong> <strong>Jet</strong> <strong>Energy</strong> <strong>Scale</strong> Calibration Factor#Events3025tt+jets semi-ele (146.9 entries)tt+jets o<strong>the</strong>r (23.4 entries)S<strong>in</strong>gleTop+jets (7.5 entries)Z+jets (3.5 entries)W+jets (15.1 entries)QCD (4.6 entries)Data (36.1 pb-1) (176.0 entries)20151050 20 40 60 80 100 120 140 160 180 200Selected Events W M T(GeV)Figure 5.28: The distribution <strong>of</strong> <strong>the</strong> transverse mass <strong>of</strong> <strong>the</strong> W boson M T . The collisiondata events are overimposed to <strong>the</strong> simulation for comparison purpose.<strong>of</strong> <strong>the</strong> top quark. The M3 variable is def<strong>in</strong>ed as <strong>the</strong> <strong>in</strong>variant mass <strong>of</strong> <strong>the</strong> three jetsamong all selected jets for which <strong>the</strong> transverse momentum <strong>of</strong> <strong>the</strong> result<strong>in</strong>g vectorialsum is <strong>the</strong> maximum. The distribution <strong>of</strong> M3 variable for all selected events can befound <strong>in</strong> Figure 5.29.#Events353025tt+jets semi-ele (146.9 entries)tt+jets o<strong>the</strong>r (23.4 entries)S<strong>in</strong>gleTop+jets (7.5 entries)Z+jets (3.5 entries)W+jets (15.1 entries)QCD (4.6 entries)Data (36.1 pb-1) (176.0 entries)20151050 100 200 300 400 500 600Selected Events M3 (GeV)Figure 5.29: The distribution <strong>of</strong> <strong>the</strong> M3, def<strong>in</strong>ed as <strong>the</strong> <strong>in</strong>variant mass <strong>of</strong> <strong>the</strong> three jetswhich yield <strong>the</strong> maximum transverse momentum <strong>of</strong> <strong>the</strong> vectorial sum. The collisiondata events are overimposed to <strong>the</strong> simulation for comparison purpose.The peak <strong>of</strong> <strong>the</strong> M3 distribution happens around 180 GeV which is close to <strong>the</strong>mass <strong>of</strong> <strong>the</strong> top quark that was used when simulat<strong>in</strong>g <strong>the</strong> physics events. Then it canbe concluded that <strong>in</strong>deed <strong>the</strong> M3 variable represents a good estimator <strong>of</strong> <strong>the</strong> <strong>in</strong>variantmass <strong>of</strong> <strong>the</strong> top quark. Aga<strong>in</strong> a good agreement between data and simulated eventscan be observed.Now that a good compatibility between <strong>the</strong> collision data and <strong>the</strong> simulation is observedconsider<strong>in</strong>g various properties <strong>of</strong> <strong>the</strong> selected events, one can run <strong>the</strong> MVA package <strong>in</strong>order to reconstructed <strong>the</strong> topology <strong>of</strong> <strong>the</strong> e+jet t¯t event. The same variables as<strong>in</strong>troduced <strong>in</strong> Section 5.1.4, are used as <strong>in</strong>put <strong>in</strong> order to tra<strong>in</strong> <strong>the</strong> Likelihood Ratiomethod. As already mentioned, <strong>the</strong> Likelihood Ratio method assigns a value to eachjet-parton comb<strong>in</strong>ation and returns <strong>the</strong> chosen jet-parton comb<strong>in</strong>ation correspond<strong>in</strong>g to<strong>the</strong> maximum Likelihood Ratio value among <strong>the</strong> 12 possible jet-parton comb<strong>in</strong>ations.