Georgia Quality Management System - Department of Behavioral ...
Georgia Quality Management System - Department of Behavioral ...
Georgia Quality Management System - Department of Behavioral ...

Create successful ePaper yourself
Turn your PDF publications into a flip-book with our unique Google optimized e-Paper software.
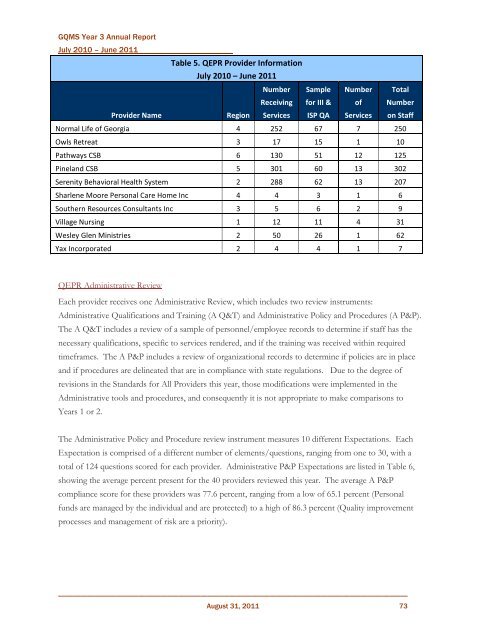
GQMS Year 3 Annual ReportJuly 2010 – June 2011Table 5. QEPR Provider InformationJuly 2010 – June 2011Number Sample Number TotalReceiving for III & <strong>of</strong> NumberProvider NameRegion Services ISP QA Services on StaffNormal Life <strong>of</strong> <strong>Georgia</strong> 4 252 67 7 250Owls Retreat 3 17 15 1 10Pathways CSB 6 130 51 12 125Pineland CSB 5 301 60 13 302Serenity <strong>Behavioral</strong> Health <strong>System</strong> 2 288 62 13 207Sharlene Moore Personal Care Home Inc 4 4 3 1 6Southern Resources Consultants Inc 3 5 6 2 9Village Nursing 1 12 11 4 31Wesley Glen Ministries 2 50 26 1 62Yax Incorporated 2 4 4 1 7QEPR Administrative ReviewEach provider receives one Administrative Review, which includes two review instruments:Administrative Qualifications and Training (A Q&T) and Administrative Policy and Procedures (A P&P).The A Q&T includes a review <strong>of</strong> a sample <strong>of</strong> personnel/employee records to determine if staff has thenecessary qualifications, specific to services rendered, and if the training was received within requiredtimeframes. The A P&P includes a review <strong>of</strong> organizational records to determine if policies are in placeand if procedures are delineated that are in compliance with state regulations. Due to the degree <strong>of</strong>revisions in the Standards for All Providers this year, those modifications were implemented in theAdministrative tools and procedures, and consequently it is not appropriate to make comparisons toYears 1 or 2.The Administrative Policy and Procedure review instrument measures 10 different Expectations. EachExpectation is comprised <strong>of</strong> a different number <strong>of</strong> elements/questions, ranging from one to 30, with atotal <strong>of</strong> 124 questions scored for each provider. Administrative P&P Expectations are listed in Table 6,showing the average percent present for the 40 providers reviewed this year. The average A P&Pcompliance score for these providers was 77.6 percent, ranging from a low <strong>of</strong> 65.1 percent (Personalfunds are managed by the individual and are protected) to a high <strong>of</strong> 86.3 percent (<strong>Quality</strong> improvementprocesses and management <strong>of</strong> risk are a priority).________________________________________________________________________________________________August 31, 2011 73