2012 HOUSTON TEXANS MEDIA GUIDE - Parent Directory - NFL.com
2012 HOUSTON TEXANS MEDIA GUIDE - Parent Directory - NFL.com
2012 HOUSTON TEXANS MEDIA GUIDE - Parent Directory - NFL.com

Create successful ePaper yourself
Turn your PDF publications into a flip-book with our unique Google optimized e-Paper software.
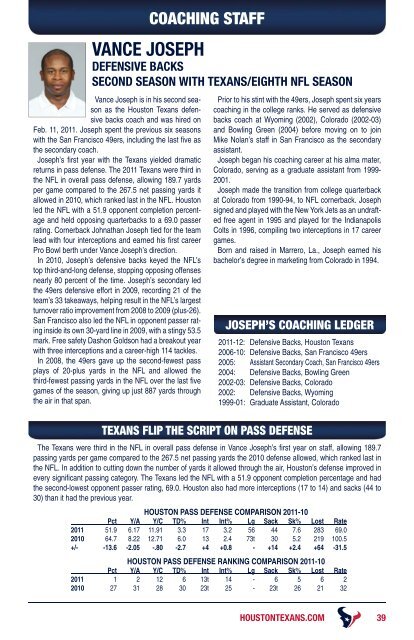
Vance Joseph is in his second seasonas the Houston Texans defensivebacks coach and was hired onFeb. 11, 2011. Joseph spent the previous six seasonswith the San Francisco 49ers, including the last fi ve asthe secondary coach.Joseph’s fi rst year with the Texans yielded dramaticreturns in pass defense. The 2011 Texans were third inthe <strong>NFL</strong> in overall pass defense, allowing 189.7 yardsper game <strong>com</strong>pared to the 267.5 net passing yards itallowed in 2010, which ranked last in the <strong>NFL</strong>. Houstonled the <strong>NFL</strong> with a 51.9 opponent <strong>com</strong>pletion percentageand held opposing quarterbacks to a 69.0 passerrating. Cornerback Johnathan Joseph tied for the teamlead with four interceptions and earned his fi rst careerPro Bowl berth under Vance Joseph’s direction.In 2010, Joseph’s defensive backs keyed the <strong>NFL</strong>’stop third-and-long defense, stopping opposing offensesnearly 80 percent of the time. Joseph’s secondary ledthe 49ers defensive effort in 2009, recording 21 of theteam’s 33 takeaways, helping result in the <strong>NFL</strong>’s largestturnover ratio improvement from 2008 to 2009 (plus-26).San Francisco also led the <strong>NFL</strong> in opponent passer ratinginside its own 30-yard line in 2009, with a stingy 53.5mark. Free safety Dashon Goldson had a breakout yearwith three interceptions and a career-high 114 tackles.In 2008, the 49ers gave up the second-fewest passplays of 20-plus yards in the <strong>NFL</strong> and allowed thethird-fewest passing yards in the <strong>NFL</strong> over the last fi vegames of the season, giving up just 887 yards throughthe air in that span.COACHING STAFFVANCE JOSEPHDEFENSIVE BACKSSECOND SEASON WITH <strong>TEXANS</strong>/EIGHTH <strong>NFL</strong> SEASONPrior to his stint with the 49ers, Joseph spent six yearscoaching in the college ranks. He served as defensivebacks coach at Wyoming (2002), Colorado (2002-03)and Bowling Green (2004) before moving on to joinMike Nolan’s staff in San Francisco as the secondaryassistant.Joseph began his coaching career at his alma mater,Colorado, serving as a graduate assistant from 1999-2001.Joseph made the transition from college quarterbackat Colorado from 1990-94, to <strong>NFL</strong> cornerback. Josephsigned and played with the New York Jets as an undraftedfree agent in 1995 and played for the IndianapolisColts in 1996, <strong>com</strong>piling two interceptions in 17 careergames.Born and raised in Marrero, La., Joseph earned hisbachelor’s degree in marketing from Colorado in 1994.JOSEPH’S COACHING LEDGER2011-12: Defensive Backs, Houston Texans2006-10: Defensive Backs, San Francisco 49ers2005: Assistant Secondary Coach, San Francisco 49ers2004: Defensive Backs, Bowling Green2002-03: Defensive Backs, Colorado2002: Defensive Backs, Wyoming1999-01: Graduate Assistant, Colorado<strong>TEXANS</strong> FLIP THE SCRIPT ON PASS DEFENSEThe Texans were third in the <strong>NFL</strong> in overall pass defense in Vance Joseph’s fi rst year on staff, allowing 189.7passing yards per game <strong>com</strong>pared to the 267.5 net passing yards the 2010 defense allowed, which ranked last inthe <strong>NFL</strong>. In addition to cutting down the number of yards it allowed through the air, Houston’s defense improved inevery signifi cant passing category. The Texans led the <strong>NFL</strong> with a 51.9 opponent <strong>com</strong>pletion percentage and hadthe second-lowest opponent passer rating, 69.0. Houston also had more interceptions (17 to 14) and sacks (44 to30) than it had the previous year.<strong>HOUSTON</strong> PASS DEFENSE COMPARISON 2011-10Pct Y/A Y/C TD% Int Int% Lg Sack Sk% Lost Rate2011 51.9 6.17 11.91 3.3 17 3.2 56 44 7.6 283 69.02010 64.7 8.22 12.71 6.0 13 2.4 73t 30 5.2 219 100.5+/- -13.6 -2.05 -.80 -2.7 +4 +0.8 - +14 +2.4 +64 -31.5<strong>HOUSTON</strong> PASS DEFENSE RANKING COMPARISON 2011-10Pct Y/A Y/C TD% Int Int% Lg Sack Sk% Lost Rate2011 1 2 12 6 13t 14 - 6 5 6 22010 27 31 28 30 23t 25 - 23t 26 21 32<strong>HOUSTON</strong><strong>TEXANS</strong>.COM 39