Water Supply Plan - City of Miami
Water Supply Plan - City of Miami
Water Supply Plan - City of Miami

You also want an ePaper? Increase the reach of your titles
YUMPU automatically turns print PDFs into web optimized ePapers that Google loves.
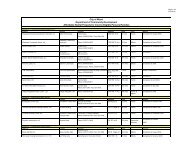
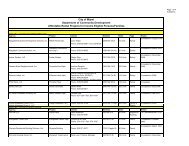
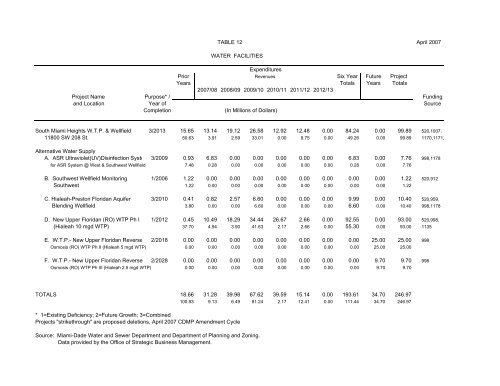
TABLE 12 April 2007<br />
WATER FACILITIES<br />
Expenditures<br />
Prior Revenues Six Year Future Project<br />
Years Totals Years Totals<br />
2007/08 2008/09 2009/10 2010/11 2011/12 2012/13<br />
Project Name Purpose* / Funding<br />
and Location Year <strong>of</strong> Source<br />
Completion (In Millions <strong>of</strong> Dollars)<br />
South <strong>Miami</strong> Heights W.T.P. & Wellfield 3/2013 15.65 13.14 19.12 26.58 12.92 12.48 0.00 84.24 0.00 99.89 520,1007,<br />
11800 SW 208 St. 50.63 3.91 2.59 33.01 0.00 9.75 0.00 49.26 0.00 99.89 1170,1171,<br />
Alternative <strong>Water</strong> <strong>Supply</strong><br />
A. ASR Ultraviolet(UV)Disinfection Syste 3/2009 0.93 6.83 0.00 0.00 0.00 0.00 0.00 6.83 0.00 7.76 998,1178<br />
for ASR System @ West & Southwest Wellfield 7.48 0.28 0.00 0.00 0.00 0.00 0.00 0.28 0.00 7.76<br />
B. Southwest Wellfield Monitoring 1/2006 1.22 0.00 0.00 0.00 0.00 0.00 0.00 0.00 0.00 1.22 520,912<br />
Southwest 1.22 0.00 0.00 0.00 0.00 0.00 0.00 0.00 0.00 1.22<br />
C. Hialeah-Preston Floridan Aquifer 3/2010 0.41 0.82 2.57 6.60 0.00 0.00 0.00 9.99 0.00 10.40 520,959,<br />
Blending Wellfield 3.80 0.00 0.00 6.60 0.00 0.00 0.00 6.60 0.00 10.40 998,1178<br />
D. New Upper Floridan (RO) WTP Ph I 1/2012 0.45 10.49 18.29 34.44 26.67 2.66 0.00 92.55 0.00 93.00 520,998,<br />
(Hialeah 10 mgd WTP) 37.70 4.94 3.90 41.63 2.17 2.66 0.00 55.30 0.00 93.00 1135<br />
E. W.T.P.- New Upper Floridan Reverse 2/2018 0.00 0.00 0.00 0.00 0.00 0.00 0.00 0.00 25.00 25.00 998<br />
Osmosis (RO) WTP Ph II (Hialeah 5 mgd WTP) 0.00 0.00 0.00 0.00 0.00 0.00 0.00 0.00 25.00 25.00<br />
F. W.T.P.- New Upper Floridan Reverse 2/2028 0.00 0.00 0.00 0.00 0.00 0.00 0.00 0.00 9.70 9.70 998<br />
Osmosis (RO) WTP Ph III (Hialeah 2.5 mgd WTP) 0.00 0.00 0.00 0.00 0.00 0.00 0.00 0.00 9.70 9.70<br />
TOTALS 18.66 31.28 39.98 67.62 39.59 15.14 0.00 193.61 34.70 246.97<br />
100.83 9.13 6.49 81.24 2.17 12.41 0.00 111.44 34.70 246.97<br />
* 1=Existing Deficiency; 2=Future Growth; 3=Combined<br />
Projects "strikethrough" are proposed deletions, April 2007 CDMP Amendment Cycle<br />
Source: <strong>Miami</strong>-Dade <strong>Water</strong> and Sewer Department and Department <strong>of</strong> <strong>Plan</strong>ning and Zoning.<br />
Data provided by the Office <strong>of</strong> Strategic Business Management.