Water Supply Plan - City of Miami
Water Supply Plan - City of Miami
Water Supply Plan - City of Miami

You also want an ePaper? Increase the reach of your titles
YUMPU automatically turns print PDFs into web optimized ePapers that Google loves.
2007 2010 2015 2020 2025 2030 2007 2010 2015 2020 2025 2030 2007 2010 2015 2020 2025 2030 2007 2010 2015 2020 2025 2030<br />
Biscayne Park 1<br />
3,443 3,453 3,471 3,476 3,480 3,484<br />
Golden Beach 2<br />
923 937 960 1,107 1,254 1,401<br />
Sunny Isles 3<br />
Included<br />
Included<br />
in <strong>City</strong> <strong>of</strong><br />
in <strong>City</strong> <strong>of</strong><br />
17,466 26,442 29,747 32,411 35,076 37,740<br />
NMB<br />
NMB<br />
Florida <strong>City</strong> 4<br />
13,105 15,371 19,148 22,466 25,783 29,101 13,105 15,371 19,148 22,466 25,783 29,101 1,498 2,005 2,851 3,284 3,718 4,151 0.23 0.31 0.44 0.51 0.58 0.64<br />
Homestead 5<br />
54,653 62,475 76,921 86,166 97,985 107,494 52,796 60,155 72,419 80,953 89,486 98,020 2,354 3,002 5,492 6,346 7,200 8,054 0.36 0.47 0.85 0.98 1.12 1.25<br />
Islandia 6<br />
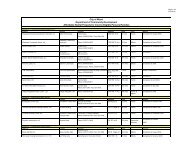
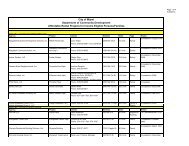
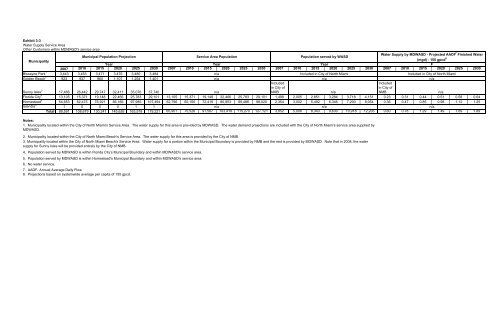
Exhibit 3-3<br />
Other Customers within MDWASD's service area<br />
Municipality<br />
Municipal Population Projection Service Area Population Population served by WASD<br />
<strong>Water</strong> <strong>Supply</strong> by MDWASD - Projected AADF<br />
1 0 0 0 1 1<br />
Total 89,591 108,679 130,247 145,626 163,578 179,221 65,901 75,526 91,567 103,418 115,270 127,121 3,852 5,008 8,343 9,630 10,918 12,205 0.60 0.78 1.29 1.49 1.69 1.89<br />
7 Finished <strong>Water</strong><br />
(mgd) - 155 gpcd 8<br />
<strong>Water</strong> <strong>Supply</strong> Service Area<br />
Year Year Year F<br />
n/a Included in <strong>City</strong> <strong>of</strong> North <strong>Miami</strong> Included in <strong>City</strong> <strong>of</strong> North <strong>Miami</strong><br />
n/a n/a n/a<br />
n/a n/a n/a<br />
n/a n/a n/a<br />
Notes:<br />
1. Municipality located within the <strong>City</strong> <strong>of</strong> North <strong>Miami</strong>'s Service Area. The water supply for this area is provided by MDWASD. The water demand projections are included with the <strong>City</strong> <strong>of</strong> North <strong>Miami</strong>'s service area supplied by<br />
MDWASD.<br />
2. Municipality located within the <strong>City</strong> <strong>of</strong> North <strong>Miami</strong> Beach's Service Area. The water supply for this area is provided by the <strong>City</strong> <strong>of</strong> NMB.<br />
3. Municipality located within the <strong>City</strong> <strong>of</strong> North <strong>Miami</strong> Beach's Service Area. <strong>Water</strong> supply for a portion within the Municipal Boundary is provided by NMB and the rest is provided by MDWASD. Note that in 2008, the water<br />
supply for Sunny Isles will be provided entirely by the <strong>City</strong> <strong>of</strong> NMB.<br />
4. Population served by MDWASD is within Florida <strong>City</strong>'s Municipal Boundary and within MDWASD's service area.<br />
5. Population served by MDWASD is within Homestead's Municipal Boundary and within MDWASD's service area.<br />
6. No water service.<br />
7. AADF- Annual Average Daily Flow<br />
8. Projections based on systemwide average per capita <strong>of</strong> 155 gpcd.