Water Supply Plan - City of Miami
Water Supply Plan - City of Miami
Water Supply Plan - City of Miami

You also want an ePaper? Increase the reach of your titles
YUMPU automatically turns print PDFs into web optimized ePapers that Google loves.
<strong>Water</strong> Facilities Master <strong>Plan</strong><br />
Population and <strong>Water</strong> Demand Projections<br />
A 4-2<br />
KM2740.Sec4.doc<br />
11/26/2007<br />
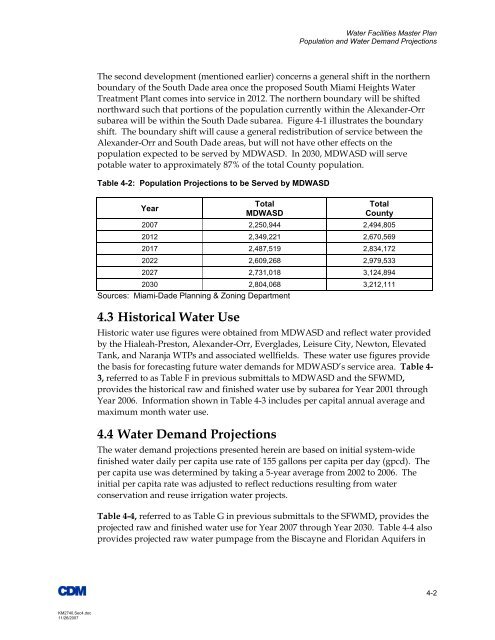
The second development (mentioned earlier) concerns a general shift in the northern<br />
boundary <strong>of</strong> the South Dade area once the proposed South <strong>Miami</strong> Heights <strong>Water</strong><br />
Treatment <strong>Plan</strong>t comes into service in 2012. The northern boundary will be shifted<br />
northward such that portions <strong>of</strong> the population currently within the Alexander-Orr<br />
subarea will be within the South Dade subarea. Figure 4-1 illustrates the boundary<br />
shift. The boundary shift will cause a general redistribution <strong>of</strong> service between the<br />
Alexander-Orr and South Dade areas, but will not have other effects on the<br />
population expected to be served by MDWASD. In 2030, MDWASD will serve<br />
potable water to approximately 87% <strong>of</strong> the total County population.<br />
Table 4-2: Population Projections to be Served by MDWASD<br />
Year<br />
Total<br />
MDWASD<br />
Total<br />
County<br />
2007 2,250,944 2,494,805<br />
2012 2,349,221 2,670,569<br />
2017 2,487,519 2,834,172<br />
2022 2,609,268 2,979,533<br />
2027 2,731,018 3,124,894<br />
2030 2,804,068 3,212,111<br />
Sources: <strong>Miami</strong>-Dade <strong>Plan</strong>ning & Zoning Department<br />
4.3 Historical <strong>Water</strong> Use<br />
Historic water use figures were obtained from MDWASD and reflect water provided<br />
by the Hialeah-Preston, Alexander-Orr, Everglades, Leisure <strong>City</strong>, Newton, Elevated<br />
Tank, and Naranja WTPs and associated wellfields. These water use figures provide<br />
the basis for forecasting future water demands for MDWASD’s service area. Table 4-<br />
3, referred to as Table F in previous submittals to MDWASD and the SFWMD,<br />
provides the historical raw and finished water use by subarea for Year 2001 through<br />
Year 2006. Information shown in Table 4-3 includes per capital annual average and<br />
maximum month water use.<br />
4.4 <strong>Water</strong> Demand Projections<br />
The water demand projections presented herein are based on initial system-wide<br />
finished water daily per capita use rate <strong>of</strong> 155 gallons per capita per day (gpcd). The<br />
per capita use was determined by taking a 5-year average from 2002 to 2006. The<br />
initial per capita rate was adjusted to reflect reductions resulting from water<br />
conservation and reuse irrigation water projects.<br />
Table 4-4, referred to as Table G in previous submittals to the SFWMD, provides the<br />
projected raw and finished water use for Year 2007 through Year 2030. Table 4-4 also<br />
provides projected raw water pumpage from the Biscayne and Floridan Aquifers in