Water Supply Plan - City of Miami
Water Supply Plan - City of Miami
Water Supply Plan - City of Miami

Create successful ePaper yourself
Turn your PDF publications into a flip-book with our unique Google optimized e-Paper software.
A<br />
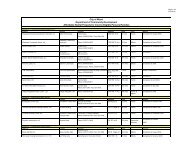
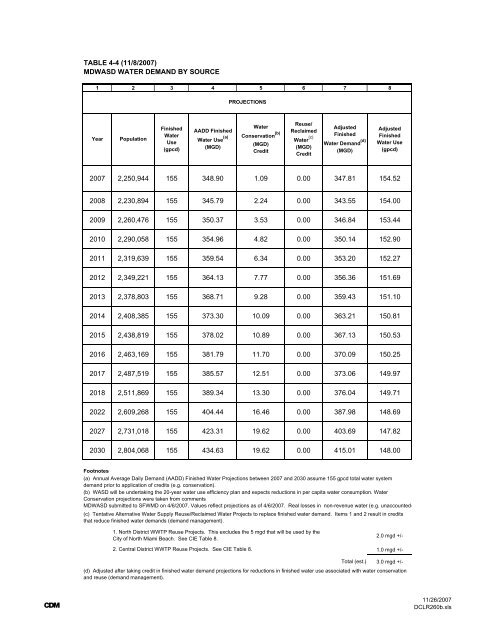
TABLE 4-4 (11/8/2007)<br />
MDWASD WATER DEMAND BY SOURCE<br />
1 2 3 4 5 6 7 8<br />
Year Population<br />
Finished<br />
<strong>Water</strong><br />
Use<br />
(gpcd)<br />
AADD Finished<br />
<strong>Water</strong> Use (a)<br />
(MGD)<br />
PROJECTIONS<br />
<strong>Water</strong><br />
Conservation (b)<br />
(MGD)<br />
Credit<br />
Reuse/<br />
Reclaimed<br />
<strong>Water</strong> (c)<br />
(MGD)<br />
Credit<br />
Adjusted<br />
Finished<br />
<strong>Water</strong> Demand (d)<br />
(MGD)<br />
Adjusted<br />
Finished<br />
<strong>Water</strong> Use<br />
(gpcd)<br />
2007 2,250,944 155 348.90 1.09 0.00 347.81 154.52<br />
2008 2,230,894 155 345.79 2.24 0.00 343.55 154.00<br />
2009 2,260,476 155 350.37 3.53 0.00 346.84 153.44<br />
2010 2,290,058 155 354.96 4.82 0.00 350.14 152.90<br />
2011 2,319,639 155 359.54 6.34 0.00 353.20 152.27<br />
2012 2,349,221 155 364.13 7.77 0.00 356.36 151.69<br />
2013 2,378,803 155 368.71 9.28 0.00 359.43 151.10<br />
2014 2,408,385 155 373.30 10.09 0.00 363.21 150.81<br />
2015 2,438,819 155 378.02 10.89 0.00 367.13 150.53<br />
2016 2,463,169 155 381.79 11.70 0.00 370.09 150.25<br />
2017 2,487,519 155 385.57 12.51 0.00 373.06 149.97<br />
2018 2,511,869 155 389.34 13.30 0.00 376.04 149.71<br />
2022 2,609,268 155 404.44 16.46 0.00 387.98 148.69<br />
2027 2,731,018 155 423.31 19.62 0.00 403.69 147.82<br />
2030 2,804,068 155 434.63 19.62 0.00 415.01 148.00<br />
Footnotes<br />
(a) Annual Average Daily Demand (AADD) Finished <strong>Water</strong> Projections between 2007 and 2030 assume 155 gpcd total water system<br />
demand prior to application <strong>of</strong> credits (e.g. conservation).<br />
(b) WASD will be undertaking the 20-year water use efficiency plan and expects reductions in per capita water consumption. <strong>Water</strong><br />
Conservation projections were taken from comments<br />
MDWASD submitted to SFWMD on 4/6/2007. Values reflect projections as <strong>of</strong> 4/6/2007. Real losses in non-revenue water (e.g. unaccounted-<br />
(c) Tentative Alternative <strong>Water</strong> <strong>Supply</strong> Reuse/Reclaimed <strong>Water</strong> Projects to replace finished water demand. Items 1 and 2 result in credits<br />
that reduce finished water demands (demand management).<br />
1. North District WWTP Reuse Projects. This excludes the 5 mgd that will be used by the<br />
<strong>City</strong> <strong>of</strong> North <strong>Miami</strong> Beach. See CIE Table 8.<br />
2. Central District WWTP Reuse Projects. See CIE Table 8.<br />
2.0 mgd +/-<br />
1.0 mgd +/-<br />
Total (est.) 3.0 mgd +/-<br />
(d) Adjusted after taking credit in finished water demand projections for reductions in finished water use associated with water conservation<br />
and reuse (demand management).<br />
11/26/2007<br />
DCLR260b.xls