Water Supply Plan - City of Miami
Water Supply Plan - City of Miami
Water Supply Plan - City of Miami

Create successful ePaper yourself
Turn your PDF publications into a flip-book with our unique Google optimized e-Paper software.
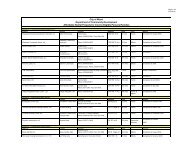
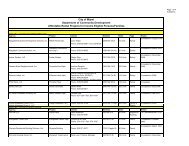
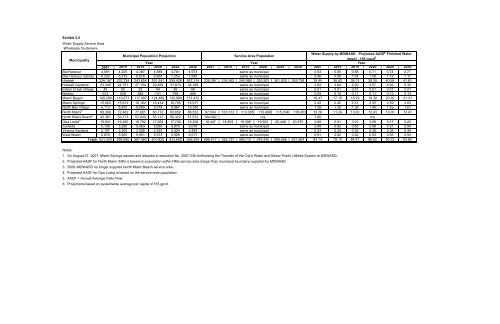
Exhibit 3-2<br />
<strong>Water</strong> <strong>Supply</strong> Service Area<br />
Wholesale Customers<br />
2007 2010 2015 2020 2025 2030 2007 2010 2015 2020 2025 2030 2007 2010 2015 2020 2025 2030<br />
Bal Harbour 4,091 4,205 4,397 4,589 4,781 4,973 0.63 0.65 0.68 0.71 0.74 0.77<br />
Bay Harbour Islands 6,200 6,379 6,678 6,965 7,253 7,540 0.96 0.99 1.04 1.08 1.12 1.17<br />
Hialeah 226,167 232,724 243,654 251,541 259,428 267,314 228,397 234,992 245,986 253,903 261,820 269,736 35.40 36.42 38.13 39.35 40.58 41.81<br />
Hialeah Gardens 23,340 24,751 27,104 29,459 31,813 34,168 3.62 3.84 4.20 4.57 4.93 5.30<br />
Indian Creek Village 49 50 52 54 56 58 0.01 0.01 0.01 0.01 0.01 0.01<br />
Medley 612 639 684 741 799 856 0.09 0.10 0.11 0.11 0.12 0.13<br />
<strong>Miami</strong> Beach 106,286 110,677 117,997 124,489 130,980 137,472 16.47 17.15 18.29 19.30 20.30 21.31<br />
<strong>Miami</strong> Springs 1<br />
15,603 15,813 16,162 16,434 16,705 16,977 2.42 2.45 2.51 2.55 2.59 2.63<br />
North Bay Village 8,113 8,405 8,890 9,379 9,867 10,356 1.26 1.30 1.38 1.45 1.53 1.61<br />
North <strong>Miami</strong> 2<br />
69,368 72,482 77,891 80,772 83,652 86,532 97,504 101,012 113,385 110,496 115,034 118,453 10.76 11.24 13.00 12.43 13.00 13.41<br />
North <strong>Miami</strong> Beach 3<br />
42,361 53,173 53,940 55,131 56,322 57,513 164,982 7.60<br />
Opa Locka 4<br />
<strong>Water</strong> <strong>Supply</strong> by MDWASD - Projected AADF<br />
Year<br />
same as municipal<br />
same as municipal<br />
same as municipal<br />
n/a<br />
15,941 16,260 16,792 17,264 17,736 18,208 18,447 18,803 19,396 19,922 20,448 20,975 2.86 2.91 3.01 3.09 3.17 3.25<br />
Surfside 5,159 5,280 5,483 5,680 5,878 6,076 0.80 0.82 0.85 0.88 0.91 0.94<br />
Virginia Gardens 2,157 2,205 2,285 2,354 2,424 2,494 0.33 0.34 0.35 0.36 0.38 0.39<br />
West <strong>Miami</strong> 5,878 5,905 5,951 5,973 5,995 6,017 0.91 0.92 0.92 0.93 0.93 0.93<br />
Total 531,324 558,950 587,960 610,825 633,689 656,554 686,817 525,727 560,731 576,430 599,556 621,564 84.14 79.14 84.47 86.82 90.32 93.65<br />
5 Finished <strong>Water</strong><br />
(mgd) - 155 gpcd 6<br />
Municipality<br />
Municipal Population Projection<br />
Year<br />
Service Area Population<br />
Year<br />
same as municipal<br />
same as municipal<br />
same as municipal<br />
same as municipal<br />
same as municipal<br />
n/a<br />
same as municipal<br />
same as municipal<br />
same as municipal<br />
Notes:<br />
1. On August 27, 2007, <strong>Miami</strong> Springs passed and adopted a resolution No. 2007-336 Authorizing the Transfer <strong>of</strong> the <strong>City</strong>'s <strong>Water</strong> and Sewer Public Utilities System to MDWASD.<br />
2. Projected AADF for North <strong>Miami</strong> (NM) is based on population within NMs service area (larger than municipal boundary) supplied by MDWASD.<br />
3. 2008 -MDWASD no longer supplies North <strong>Miami</strong> Beach service area.<br />
4. Projected AADF for Opa Locka is based on the service area population<br />
5. AADF = Annual Average Daily Flow<br />
6. Projections based on systemwide average per capita <strong>of</strong> 155 gpcd.