Water Supply Plan - City of Miami
Water Supply Plan - City of Miami
Water Supply Plan - City of Miami

Create successful ePaper yourself
Turn your PDF publications into a flip-book with our unique Google optimized e-Paper software.
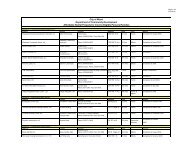
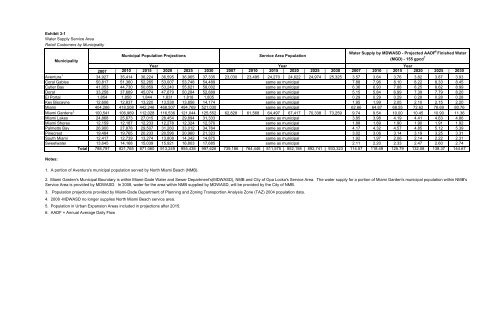
Exhibit 3-1<br />
<strong>Water</strong> <strong>Supply</strong> Service Area<br />
Retail Customers by Municipality<br />
2007 2010 2015 2020 2025 2030 2007 2010 2015 2020 2025 2030 2007 2010 2015 2020 2025 2030<br />
Aventura 1<br />
34,927 35,414 36,224 36,595 36,965 37,335 23,030 23,495 24,270 24,622 24,974 25,325 3.57 3.64 3.76 3.82 3.87 3.93<br />
Coral Gables 50,817 51,360 52,265 53,007 53,748 54,489 7.88 7.96 8.10 8.22 8.33 8.45<br />
Cutler Bay 41,053 44,730 50,859 53,240 55,621 58,002 6.36 6.93 7.88 8.25 8.62 8.99<br />
Doral 33,258 37,689 45,074 47,679 50,284 52,889 5.15 5.84 6.99 7.39 7.79 8.20<br />
El Portal 1,854 1,850 1,844 1,831 1,818 1,805 0.29 0.29 0.29 0.28 0.28 0.28<br />
Key Biscayne 12,606 12,837 13,220 13,538 13,856 14,174 1.95 1.99 2.05 2.10 2.15 2.20<br />
<strong>Miami</strong> 404,266 418,508 442,246 468,507 494,769 521,030 62.66 64.87 68.55 72.62 76.69 80.76<br />
<strong>Miami</strong> Gardens 2<br />
Municipal Population Projections Service Area Population<br />
<strong>Water</strong> <strong>Supply</strong> by MDWASD - Projected AADF<br />
100,541 106,969 112,028 116,536 121,044 125,552 62,828 61,568 64,497 67,417 70,338 73,259 9.74 9.54 10.00 10.45 10.90 11.36<br />
<strong>Miami</strong> Lakes 24,868 25,673 27,015 28,454 29,894 31,333 3.85 3.98 4.19 4.41 4.63 4.86<br />
<strong>Miami</strong> Shores 12,159 12,187 12,233 12,278 12,324 12,370 1.88 1.89 1.90 1.90 1.91 1.92<br />
Palmetto Bay 26,900 27,878 29,507 31,260 33,012 34,764 4.17 4.32 4.57 4.85 5.12 5.39<br />
Pinecrest 19,484 19,765 20,233 20,596 20,960 21,323 3.02 3.06 3.14 3.19 3.25 3.31<br />
South <strong>Miami</strong> 12,417 12,739 13,274 13,808 14,342 14,875 1.92 1.97 2.06 2.14 2.22 2.31<br />
Sweetwater 13,645 14,168 15,039 15,921 16,803 17,685 2.11 2.20 2.33 2.47 2.60 2.74<br />
Total 788,797 821,765 871,060 913,249 955,438 997,626 739,186 764,446 811,575 852,158 892,741 933,323 114.57 118.49 125.79 132.08 138.37 144.67<br />
6 Finished <strong>Water</strong><br />
(MGD) - 155 gpcd 7<br />
Municipality<br />
Year Year Year<br />
same as municipal<br />
same as municipal<br />
same as municipal<br />
same as municipal<br />
same as municipal<br />
same as municipal<br />
same as municipal<br />
same as municipal<br />
same as municipal<br />
same as municipal<br />
same as municipal<br />
same as municipal<br />
Notes:<br />
1. A portion <strong>of</strong> Aventura's municipal population served by North <strong>Miami</strong> Beach (NMB).<br />
2. <strong>Miami</strong> Garden's Municipal Boundary is within <strong>Miami</strong>-Dade <strong>Water</strong> and Sewer Department's(MDWASD), NMB and <strong>City</strong> <strong>of</strong> Opa Locka's Service Area. The water supply for a portion <strong>of</strong> <strong>Miami</strong> Garden's municipal population within NMB's<br />
Service Area is provided by MDWASD. In 2008, water for the area within NMB supplied by MDWASD, will be provided by the <strong>City</strong> <strong>of</strong> NMB.<br />
3. Population projections provided by <strong>Miami</strong>-Dade Department <strong>of</strong> <strong>Plan</strong>ning and Zoning Transportion Analysis Zone (TAZ) 2004 population data.<br />
4. 2008 -MDWASD no longer supplies North <strong>Miami</strong> Beach service area.<br />
5. Population in Urban Expansion Areas included in projections after 2015.<br />
6. AADF = Annual Average Daily Flow