Water Supply Plan - City of Miami
Water Supply Plan - City of Miami
Water Supply Plan - City of Miami

Create successful ePaper yourself
Turn your PDF publications into a flip-book with our unique Google optimized e-Paper software.
Year<br />
<strong>City</strong> <strong>of</strong> <strong>Miami</strong><br />
<strong>Water</strong> <strong>Supply</strong> Facilities Work <strong>Plan</strong>s<br />
___________________________________________________________________<br />
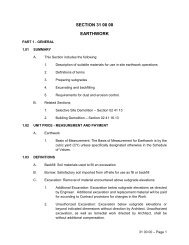
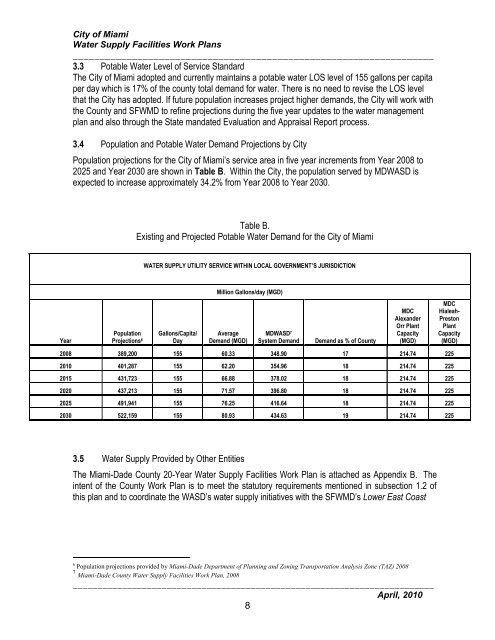
3.3 Potable <strong>Water</strong> Level <strong>of</strong> Service Standard<br />
The <strong>City</strong> <strong>of</strong> <strong>Miami</strong> adopted and currently maintains a potable water LOS level <strong>of</strong> 155 gallons per capita<br />
per day which is 17% <strong>of</strong> the county total demand for water. There is no need to revise the LOS level<br />
that the <strong>City</strong> has adopted. If future population increases project higher demands, the <strong>City</strong> will work with<br />
the County and SFWMD to refine projections during the five year updates to the water management<br />
plan and also through the State mandated Evaluation and Appraisal Report process.<br />
3.4 Population and Potable <strong>Water</strong> Demand Projections by <strong>City</strong><br />
Population projections for the <strong>City</strong> <strong>of</strong> <strong>Miami</strong>’s service area in five year increments from Year 2008 to<br />
2025 and Year 2030 are shown in Table B. Within the <strong>City</strong>, the population served by MDWASD is<br />
expected to increase approximately 34.2% from Year 2008 to Year 2030.<br />
Population<br />
Projections 6<br />
Table B.<br />
Existing and Projected Potable <strong>Water</strong> Demand for the <strong>City</strong> <strong>of</strong> <strong>Miami</strong><br />
WATER SUPPLY UTILITY SERVICE WITHIN LOCAL GOVERNMENT’S JURISDICTION<br />
Gallons/Capita/<br />
Day<br />
Million Gallons/day (MGD)<br />
Average<br />
Demand (MGD)<br />
MDWASD 7<br />
System Demand<br />
Demand as % <strong>of</strong> County<br />
MDC<br />
Alexander<br />
Orr <strong>Plan</strong>t<br />
Capacity<br />
(MGD)<br />
2008 389,200 155 60.33 348.90 17 214.74 225<br />
2010 401,287 155 62.20 354.96 18 214.74 225<br />
2015 431,723 155 66.88 378.02 18 214.74 225<br />
2020 437,213 155 71.57 396.80 18 214.74 225<br />
2025 491,941 155 76.25 416.64 18 214.74 225<br />
2030 522,159 155 80.93 434.63 19 214.74 225<br />
3.5 <strong>Water</strong> <strong>Supply</strong> Provided by Other Entities<br />
The <strong>Miami</strong>-Dade County 20-Year <strong>Water</strong> <strong>Supply</strong> Facilities Work <strong>Plan</strong> is attached as Appendix B. The<br />
intent <strong>of</strong> the County Work <strong>Plan</strong> is to meet the statutory requirements mentioned in subsection 1.2 <strong>of</strong><br />
this plan and to coordinate the WASD’s water supply initiatives with the SFWMD’s Lower East Coast<br />
6 Population projections provided by <strong>Miami</strong>-Dade Department <strong>of</strong> <strong>Plan</strong>ning and Zoning Transportation Analysis Zone (TAZ) 2008<br />
7 <strong>Miami</strong>-Dade County <strong>Water</strong> <strong>Supply</strong> Facilities Work <strong>Plan</strong>, 2008<br />
_________________________________________________________________________<br />
April, 2010<br />
8<br />
MDC<br />
Hialeah-<br />
Preston<br />
<strong>Plan</strong>t<br />
Capacity<br />
(MGD)